The year under review was a challenging one for stock exchanges everywhere, marked by uncertainties in
the operating environment. Nevertheless, Bursa Malaysia delivered a good set of financial results for the year.
29% growth in PATAMI
Bursa Malaysia achieved a PATAMI of RM146.2 million in 2011, significantly higher by 29% over the RM113 million recorded in the previous financial year. The improvement in PATAMI came on the back of higher revenues from both securities and derivatives trade as well as prudent cost management. Our ROE rose from 13% in 2010 to 17% in 2011, while our cost to income ratio improved from 55% in 2010 to 51% in 2011.
RM million
2011
2010
% change
Operating Revenue
Other Income
Operating Expenses
381.3
38.8
(214.0)
331.3
29.8
(197.3)
+15%
+30%
+8%
PBT
Income Tax Expense
206.1
(54.8)
163.8
(48.2)
+26%
+14%
PAT
Minority Interest
151.3
(5.1)
115.6
(2.6)
+31%
+99%
PATAMI
146.2
113.0
+29%
15% growth in operating revenue
Total operating revenue grew from RM331.3 million to RM381.3 million, representing an improvement of 15% over 2010. This may be attributed to a number of key factors, namely, growing participation from both foreign and domestic investors in securities and derivatives trading, the in-built resilience of the Malaysian market and the strong fundamentals of the local economy.
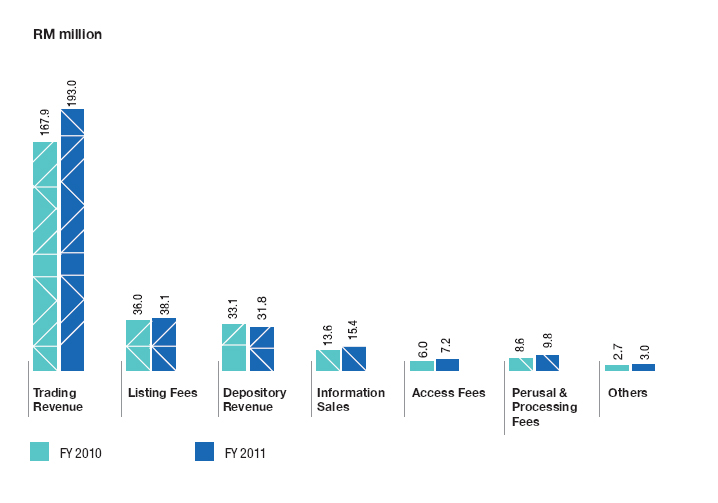
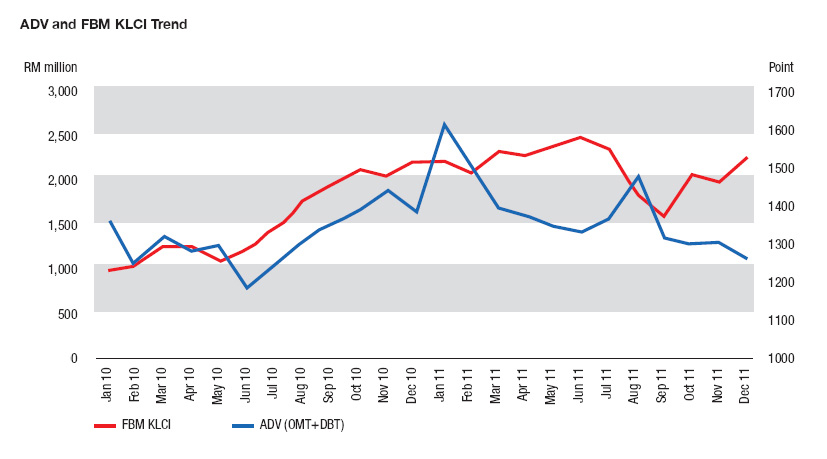
Trading activity on the Securities market in 2011 saw Average Daily Value (ADV) grow by 14% to RM1.79 billion, and trading revenue improve by 15% to RM193 million.
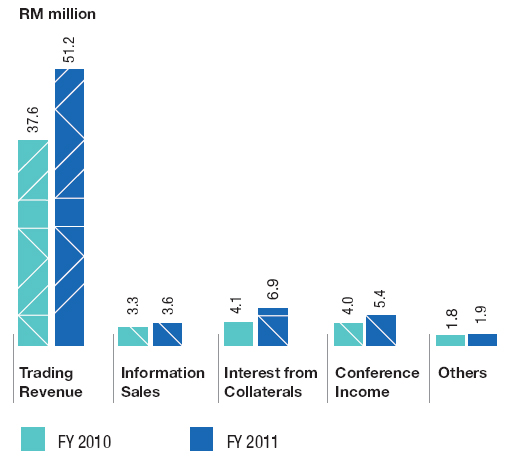
On the Derivatives front, 2011 was a remarkable year of achievements following the migration of our products to the CME Globex® trading platform which provided Bursa Malaysia with greater international visibility. This, coupled with efforts to broaden our intermediary network, led to foreign interest increasing from an average of 27% of Derivatives trades in 2010 to 31% in 2011. The overall improvement in both foreign and local trading activity saw Average Daily Contracts (ADC) grow by 39% to 34,474 contracts and trading revenue from the Derivatives market strengthen by 36% to RM51.2 million.
Higher trading activity on both the Securities and Derivatives markets led to an increase in demand for information, and, consequently, a growth in information services revenue of 13% to RM19.2 million. Listing fees saw an increase of 6% to RM38.2 million due to higher market valuation and an increase in the number of structured warrants from 204 listings in 2010 to 363 listings in 2011. We also saw more trading participants subscribing to direct market access, which increased our total access fees by 19% to RM8.7 million. Depository services income posted a decrease of 4% to RM31.7 million, while broker services and participants income saw growth of 4% and 6% to RM11.7 million and RM3.2 million respectively from 2010.
30% growth in other income
Other income grew by 30%, from RM29.8 million in 2010 to RM38.8 million in the year under review. This growth was due mainly to higher fund size and enhanced yields from investment income.
Better cost management
On the cost side, expenses grew by 8%, from RM197.3 million previously to RM214 million. The growth in expenses came mainly from an increase in staff costs and Globex® service fees (a cost which varies proportionately with the volume traded on the Derivatives market). Without taking the latter costs into consideration, expenses registered only a marginal 4% increase over the previous year, which is reflective of the measures put in place to ensure controlled and focused spending.
Strong balance sheet
Our net assets grew by 1% to RM874.6 million as at 31 December 2011.
Non-current assets were lower in 2011 at RM427 million. This was primarily due to the progressive utilisation of our fixed assets, which are charged out as depreciation and amortisation, and the lower value of our equity investment in CME.
Current assets were higher at RM574.6 million owing to higher funds from an increase in trading revenue on the Securities and Derivatives markets. These funds were invested both in investment securities and money market instruments.
Non-current liabilities were lower at RM46 million due to lower deferred tax liabilities, while current liabilities were fairly stable at RM81 million.
Total equity was fairly stable, increasing by only 1%.
RM million
2011
2010
% change
Assets belonging to the Group
Non-current
Current
427.0
574.6
472.3
525.6
-10%
+9%
Total Assets
1,001.6
997.9
+0.4%
Liabilities of the Group
Non-current
Current
46.0
81.0
52.1
82.2
-12%
-2%
Total Liabilities
127.0
134.3
-5%
Net Assets
874.6
863.6
+1%
Equity belonging to
Shareholders of Bursa Malaysia
Minority interest
860.4
14.2
852.3
11.3
+1%
+26%
Total Equity
874.6
863.6
+1%
Capital expenditure
We spent RM13.6 million on capital expenditure in 2011, of which 86% was allocated to information technology systems. The main item of expenditure was the development of a clearing system for the Derivatives market. We also commenced the revamp of our website in 2011 and replaced certain internal IT systems. The remaining 14% was expended in non-technology assets.
Healthy cash flows
Our cash position grew by 11% to RM499.9 million as at 31 December 2011, primarily a result of higher trading activity on the Securities market. This is reflected in the cash flows from operating activities of RM177 million which were primarily used to pay dividends to shareholders of Bursa Malaysia.
RM million
Balance as at 1 January 2011
Net increase in cash due to: Operating activities Investing activities Financing activities
177.0
(4.5)
(122.5)
449.9
49.9
Balance as at 31 December 2011
499.9
Rewarding shareholders
In 2011 we paid an interim dividend of 13 sen per share. Our Board has proposed 13 sen per share as our final dividend, subject to shareholders’ approval at the Annual General Meeting on 29 March 2012. This will bring total dividends for the year to 26 sen per share, representing a payout of 95% of our profits to our shareholders in financial year 2011 and maintaining our high payout trend.
SEGMENTAL REVIEW
Growth in key business segments
Our two key segments, the Securities and Derivatives markets, reported a healthy growth in profit as a result of higher trading activities.
The Securities market segment reported improved profit from RM189.1 million in 2010 to RM219.4 million in 2011, driven by greater activity from both domestic and foreign participants, hence generating higher trading revenue.
The volatility observed during the year was particularly evident in the first quarter where the FBM KLCI fell 2.09% on 10 February 2011 in line with heavy corrections on regional bourses triggered by China’s interest rate hike. It was also clear that the selling pressures in the first quarter were triggered by such external events as the political developments in the Middle East, the Japanese earthquake and fears of radiation leaks from Japan’s damaged nuclear reactors. Market sentiment improved in the second quarter due to positive growth indicators reported for the Malaysian economy. In the third quarter, the market was heavily affected by developments in the US economy and in the EU, plunging over two days by 1.8% and 1.66% respectively on 8 and 9 August 2011, in line with heavy regional falls, but recovered in the fourth quarter on positive news in relation to the Malaysian economy.
We also saw increases in listing fees, information sales, access fees and perusal and processing fees. Depository services saw a drop due to high public issue fees from a large listing in 2010.
Segment expenses increased marginally by 6% to RM94.2 million. This was largely due to higher human capital costs.
Market capitalisation at end of period (RM billion)
1,284.54
1,275.28
Increased hedging activities lead to 73% growth in Derivatives profit
The Derivatives market segment reported a healthy 73% growth in operating profit from RM21.3 million in 2010 to RM36.8 million in 2011, mainly driven by better visibility enjoyed in the past year by the Derivatives market and increased market volatility which encouraged the appetite for more hedging activities.
Records were broken for total Derivatives contracts traded, and total FCPO contracts posted a 31-year all-time high. The total Derivatives contracts traded increased by a significant 37% to 8.45 million in 2011, up from 6.15 million a year earlier. Contracts traded for FKLI registered a 24% increase to 2.48 million from 1.99 million in 2010, while FCPO contracts posted a 45% growth to 5.87 million from 4.06 million previously. These milestones translated into higher trading revenues for the Derivatives market.
Analysis of the demography of players showed that participation of institutional and retail segments recorded higher trades after the migration of our derivatives products onto the CME Globex® trading platform. For FCPO contracts, foreign institutional participation grew from 25% in 2010 to 28% in 2011 whilst for the FKLI contract, it recorded an improvement from 33% in 2010 to 37% in 2011. More visibility also resulted in our attracting High Frequency Traders (HFTs), who contributed 6% of Derivatives market share in 2011.
With greater awareness and promotion via Internet Trading to the domestic retail market, the number of new futures trading accounts grew by 29% from 35,000 in 2010 to 45,000 accounts in 2011. The trading composition by domestic retailers in 2011 for the FKLI was 42% (1.04 million contracts), and for the FCPO, it was 24% (1.44 million contracts).
The improvement in trade volumes increased the need for more information with the result that information services income gained ground. The number of open interests on the Derivatives market likewise increased, and with that came higher guarantee fees and interest income from margins. As our annual Palm Oil Conference gained wider recognition, it attracted greater participation which resulted in higher conference income. Total operating revenue grew by RM18.2 million in 2011.
Segment expenses increased by RM3.5 million, due mainly to the service fees paid to CME for the trading of our products on Globex® trading platform. This was partially offset by a cessation of system costs from the previous trading system.
Derivatives Market Results
RM million
2011
2010
% change
Operating Revenue
Other Income
Direct Costs*
69.0
3.4
(35.6)
50.8
2.6
(32.1)
+36%
+31%
+11%
Segment Profit
36.8
21.3
+73%
* Included in direct costs is Globex® service fees of RM11.5 million and RM2.7 million in 2011 and 2010 respectively.
Key derivatives market data
2011
2010
FCPO contracts (million)
FKLI contracts (million)
Other contracts (million)
5.87
2.48
0.10
4.06
1.99
0.10
Total contracts (million)
8.45
6.15
ADC
34,474
24,818
Open interests as at 31 December
152,419
132,151
Exchange holding company
The exchange holding company recorded a segment profit of RM17.1 million in 2011, an increase of 21% compared to the RM14.1 million level of 2010. The higher profit recorded during the year under review is attributed to higher investment income as a result of a higher level of funds from subsidiary dividends and enhanced yields.
Other businesses
Our other businesses are the operation of BSAS, Electronic Trading Platform and an offshore market. The increase in segment loss from RM7.6 million in 2010 to RM8.8 million in 2011 was a result of higher system costs.
OPERATIONAL REVIEW
Securities Market
Our overall strategy in 2011 incorporated a focus on improving liquidity and enhancing vibrancy of the Securities market. Some of the more notable developments during the year are described below.
New listings
In the year under review, there were 28 Initial Public Offerings (IPOs) compared to 29 achieved in 2010. The total funds raised through such IPOs in 2011 amounted to RM6.7 billion, of which the largest listing by funds raised was Bumi Armada Berhad, at RM2.7 billion. By comparison, the largest IPO in the previous year achieved RM12.8 billion in funds raised on listing, thereby bringing the total IPO funds raised in that year to RM19.9 billion. Meanwhile, there were 125 secondary capital issues in 2011, as against 105 in 2010. The capital raised by these secondary issues in the year under review totalled RM8.3 billion, as compared to RM13.1 billion in the previous year. On the other hand, the number of newly-listed structured warrants grew by nearly 78% to 363, compared with 204 in 2010.
In building the IPO supply pipeline, Bursa Malaysia undertook a number of exercises in 2011 which included the launch of a Practical Guide to Listing to help aspiring companies prepare themselves to go public and better manage their listing process. We also worked with agencies such as TERAJU and SME Corp to organise seminars for their members on listing as a capital-raising platform for companies. These were followed by IPO clinics for selected companies which assessed the companies individually and provided a diagnostic of the companies' readiness to go public and advised on next steps.
Showcasing sectors and companies
A series of quarterly events called "In the Spotlight" with a sectoral focus was launched by Bursa Malaysia in the year under review to provide a platform for listed companies to showcase their progress and potential to the investment community. Three sessions were conducted during the year, and participation was encouraging with at least 200 members of the investment community in attendance including fund managers, analysts and wealth managers.
Developing Exchange Traded Fund (ETF)
In line with our efforts to expand our ETF product range, the focus was on increasing the supply and at the same time enhancing investor awareness via a series of educational seminars which commenced in June 2011. As a result, the average daily volume for ETFs increased by 10% in comparison with 2010, from 1 million to 1.1 million.
The government, taking cognizance of the importance of the development of the ETF market, announced the allocation of RM200 million to seed new Shari’ah-compliant ETFs in the 2012 Federal Budget. A wholly-owned subsidiary of ValueCap Sdn Bhd will be providing the funding to attract both local and foreign issuers to list more ETFs in Malaysia.
ASEAN Exchanges Collaboration
Bursa Malaysia, Hanoi Stock Exchange, Hochiminh Stock Exchange, Indonesia Stock Exchange, The Philippine Stock Exchange Inc, Singapore Exchange and The Stock Exchange of Thailand collaborated to form ASEAN Exchanges with a mission to establish an interlinked ASEAN capital market via greater cross-border investments, mobilisation of intra-ASEAN funds and trading of equity markets. The alliance saw the launch of ASEAN Brand Identity, ASEAN Exchanges website and ASEAN Stars with the intent to promote the growth of the ASEAN capital market and spur higher liquidity in the region.
ASEAN Brand Identity is a logo that represents the spirit of cooperation among South East Asian Nations, whilst the website features the ASEAN Stars and future ASEAN-centric products and initiatives. The ASEAN Exchanges website provides investors with an integrated single-window view into the ASEAN capital market, which has a combined market capitalisation of approximately USD1.8 trillion and the participation of more than 3,000 companies. ASEAN Stars are made up of a selection of the top 30 stocks from each exchange, ranked in terms of market capitalisation and liquidity.
Guided by the ASEAN Economic Community blueprint, the collaboration of ASEAN Exchanges will jointly promote the development of ASEAN as an asset class through a collaborative framework with the intent of increasing liquidity to member exchanges. This will be achieved through a focused strategy that includes driving cross-border collaboration, streamlining access to ASEAN, creating ASEAN-centric products and implementing targeted promotional initiatives.
Institutional investor engagements
The twin strategic objectives of the Invest Malaysia Programme are business development (diversifying and broadening our investor base) and communicating the Malaysia Story (Malaysia’s transformational changes and investment opportunities) for both portfolio and direct investments.
All the above elements of the Malaysia Story are aimed to promote Malaysia as a favourable investment destination.
Invest Malaysia
Our annual flagship “Invest Malaysia” Kuala Lumpur (KL) conference remains a permanent feature in the calendars of many institutional investors, local and foreign. The seventh Invest Malaysia KL event was held in April 2011, attracting approximately 1,000 local and foreign institutional investors, including fund managers, media representatives and government officials. Invest Malaysia KL continues to be a national effort, showcasing portfolio and direct investments under one roof, and remains both a communication platform as well as a springboard for continuing action. The Prime Minister in his Keynote Address drew attention to the achievements of the last two years and promised to focus on the task of implementation. Malaysia’s Second Capital Market Master Plan was launched at Invest Malaysia KL 2011.
As a follow-through, Invest Malaysia New York was held in May 2011, in conjunction with the Prime Minister’s visit to New York. It was the result of collaboration between Bursa Malaysia and NYSE Euronext, the Malaysian Industrial Development Authority and sponsoring brokers which included CIMB Investment Bank, Maybank Investment Bank and J.P. Morgan Securities. The highlights were the Special Address by the Prime Minister and his private session with top-tier fund managers, asset allocators and industry participants. In addition, 10 Malaysian corporate representatives held scheduled meetings with US fund managers.
The second instalment of Invest Malaysia Hong Kong was held in November 2011, in collaboration with OSK Investment Bank, targeting mid-tier funds. A total of 14 Malaysian corporations were featured, including small and mid capitalised stocks. These stocks are long-term beneficiaries of the ETP as well as ASEAN champions and showcased the potential and tenacity of Malaysian companies. Meanwhile, following the inaugural Invest Malaysia Beijing in 2010, a roadshow to Shanghai was organised on 1 and 2 November 2011, targeting QDII funds.
Retail investors
The retail investor segment has always been a priority with Bursa Malaysia. As such, our commitment has been to engage, develop and retain this segment by educating and creating awareness of the various product offerings and services of the Exchange. Our emphasis would be to continue to inspire and educate retail investors as well as persuade them to view the capital market as a place of investment opportunity.
To sustain and engage our existing investors, we continued our efforts through the annual “Market Chat” programme. Apart from expanding its outreach by 60% from 2,700 participants when we first initiated this programme in 2007 to 12,000 in 2011, Market Chat has given a boost to trading activities amongst retail investors especially in locations outside the main market centres of Klang Valley, Johor Bahru, Penang, Kota Kinabalu and Kuching. To keep the momentum going, participating brokers have expanded their operations by establishing new branches and this has spurred new interest in trading.
Young investors
During the year, some 1,700 students visited Bursa Malaysia in line with our corporate social responsibility efforts to educate the young in the business and workings of the capital market.
Enhancing trading efficiency
On 18 April 2011, Bursa Malaysia Securities introduced the Day Order with the aim of promoting efficiency in order creation and avoiding unnecessary duplication in data entry for unmatched orders between the morning and afternoon sessions. Previously, all orders were Session Orders and when entered into the trading system, were valid for a single session only. With Day Order, all unmatched orders from the morning session are automatically carried forward to the afternoon session and considered as valid for the entire trading day.
In line with the implementation of Day Order, a single trading limit of 30% for shares above RM1.00 and RM0.30 sen for shares below RM1.00 was also introduced for the whole trading day instead of per single trading session.
New sector indices
On 3 October 2011, the FTSE Group (FTSE) and Bursa Malaysia launched a new set of Industry, Supersector and Sector indices to complement the existing FTSE Bursa Malaysia Index Series. The new set of 10 Industry, 19 Supersector and 39 Sector Indices was designed to provide investors with a comprehensive set of tools for in-depth analysis of the Malaysian stock market in general and sectoral performance in particular. Benchmarked against a global standard, the indices will also enable investors to make cross-border comparisons between sectors and industries in Malaysia and other countries.
In conjunction with this extension of the existing FTSE Bursa Malaysia Index Series, the free-float methodology for the FTSE Bursa Malaysia Index Series has been reviewed and enhanced, to ensure the indices continue to provide the most accurate reflection of the Malaysian Securities market opportunity.
eDividend implementation
Electronic dividend or eDividend is a dividend payment system whereby the dividend proceeds are credited directly into the entitled shareholders’ bank accounts. Since the implementation of eDividend on 19 April 2010, the number of CDS account holders opting for eDividend increased from 1.2 million accounts as at 31 December 2010, to 1.4 million accounts as at 31 December 2011. The total number of dividend payments made under eDividend since inception was 1,022, with an average of 77% dividend payout to shareholders via eDividend.
Enhancing trade settlement
On 27 December 2011, the Clearing House changed the timing of book entry delivery of securities from 9.00 a.m. on T+3 to 10.00 a.m. on T+3.The reason for this change was to synchronise the timing of book entry delivery of securities with the payment of funds, which is effected by 10.00 a.m. on T+3. The Clearing House has also liberalised the requirement for Clearing Participants to operate designated settlement accounts with the Clearing House appointed Clearing Banks for settlement in Ringgit Malaysia.With this liberalisation, Clearing Participants now have the flexibility to select their preferred banks for settlement with the Clearing House.
Improving Securities Borrowing and Lending framework
The Companies (Prescribed Interest) Regulations 2011 came into operation on 15 November 2011 in regard to Securities Borrowing and Lending (SBL) arrangements. Under the new regulations, a lender and borrower of substantial shareholdings are exempt from notification requirements in relation to an interest arising from an SBL transaction, provided the borrower does not keep the borrowed securities for more than three business days.
Derivatives Market
In 2011, we continued to grow our Derivatives business by focusing on improving trading access, broadening our intermediary network and improving global visibility of our products. The highlights of our activities are described below.
Trading of FKLI contracts by US persons
We achieved a regulatory breakthrough when the United States Commodity Futures Trading Commission (CFTC) allowed the buying and selling of Kuala Lumpur Composite Index Futures Contracts (FKLI) by persons based in the US, with effect from 28 June 2011.
Clearing developments
The replacement of the Derivatives Clearing System (DCS) continued during the year, with the aim to provide better infrastructure for the Clearing House to facilitate new and complex product launches. Other operational clearing enhancements were completed in 2011, including additional calendar spreads for FCPO contracts from 15 to 105 spreads, and an extended scope of acceptance of Letters of Credit from customers directly, as margin collateral.
Increasing Market Participants
Dual Licensing Fast Track Programme
The year 2011 saw the liberalisation of requirements for certain sales personnel of the Derivatives market with approval from the SC. Under the Dual licensing Fast Track Programme (DLFT), qualified Dealer Representatives (DR) in the Securities market with 10 years of experience are also able to act as Futures Broker Representatives (FBR) to trade on behalf of their clients in the Derivatives market. This is done by completing a four-day Dual Licensing Fast Track (DLFT) Programme jointly organised by the Securities Industry Development Corporation (SIDC) and BMD. The said programme dispenses with the need to sit for examinations as required previously.
As at 31 January 2012, there was a marked increase of 155 FBRs who were granted relevant licences by the SC to trade in futures contracts, as a result of the above DLFT Programme. They make up 20% of the dual-licence population qualified to trade in both Securities and Derivatives contracts.
Liberalisation of Requirements for Local Participants
The Exchange continues to attract more Local Participants (Locals) to our Derivatives market. They are proprietary traders who provide liquidity to the market by offering a bid and ask price at regular intervals and are akin to pseudo Market Makers. The high-entry requirements to become a Local have been prohibitive. Given their ageing profile, their role as liquidity providers, and the fact that they contribute approximately one-third of our total market volume, the need to recruit a new generation of Locals had become imperative.
On 31 October 2011, the Securities Commission approved the liberalisation of Local admission requirements which are expected to facilitate the entry of more Locals into the market. In a related development, the Ministry of Finance had on 14 November 2011, approved a five-year extension of tax abatement for Locals. With this extension, a Local is now entitled to an abatement of adjusted income at a rate equivalent to 50% on the income derived from trading professionally on Bursa Derivatives for the years 2012 to 2016.
Both the liberalisation and tax abatement incentives are aimed at growing the Locals community in a sustainable way to enhance market liquidity. Roadshows with an educational focus have been planned across the country to recruit Locals, to be conducted jointly by the Exchange and its Trading Participants (TP).
Branding and awareness
Retail Initiatives - Talk Futures’ Educational Series
A retail educational series commenced in June 2011 in partnership with certain TPs, with more than 105 events organised till year-end. Locations ranged from smaller townships to major cities nationwide, including Sabah and Sarawak. A six-part series of articles on ‘How to Trade Futures’ was also published in the local newspapers to create awareness and educate investors on Derivatives trading.
Institutional Reach
Palm & Lauric Oils Conference and Exhibition
The annual Palm & Lauric Oils Conference and Exhibition (POC2011) was a success with a record turnout. More than 2,000 delegates attended, originating from 59 countries, to hear top speakers share their views on the industry. Participants came from a variety of sectors and included physical commodity traders, financial traders, millers, refiners, shippers, fund managers, importers, plantation managers and those involved in the bio-fuel energy segment. The theme of ‘Weathering Challenges... Maximising Opportunities’ was believed apt, given the recent volatility in commodity prices as a result of changes in weather patterns. Special attention was accorded to China at this year’s event due to its growing influence on commodity prices.
China Oils and Oilseeds Conference (CIOC)
The annual CIOC event recorded participation from over 800 delegates from Malaysia, China, the US and other countries. The strategic collaboration that was forged with the Dalian Commodity Exchange since 2006 came to fruition with increased participation in the Conference and interest in our palm oil market. This event is aimed at fostering a working relationship between the two countries to support Government-to-Government initiatives and promote the oils and oilseeds markets together with the Ministry of Plantation Industries & Commodities Malaysia. It is also designed to facilitate the import and export of palm-related products between Malaysia and China via hedging mechanisms.
Other Institutional Events
BMD participated at various other strategic events which included Globoil Mumbai, the International Palm Oil Conference in Bali and the PORAM Annual Forum in Kuala Lumpur. We also collaborated with CME at IDX London, FIA Chicago and FIA Singapore. In China, we embarked on a market awareness programme across four cities i.e. Shanghai, Beijing, Hangzhou and Guangzhou in April.
Product development initiatives
New Product Facilities
The Exchange introduced the Negotiated Large Trades (NLTs) facilities to the marketplace on 30 November 2011, in response to market demand for ease of matching large trades with a single price. The physical delivery support infrastructure and processes for our crude palm oil futures contract were rationalised during the year. The Exchange also embarked on attracting new Port Tank Installations with a view to securing a healthy pipeline of storage infrastructure as preparation for the eventual launch of other palm oil Derivatives contracts.
Products in Progress
The Exchange is working on new products which will complement our equity derivatives marketplace. We continued with regular product briefings to our regulators, TPs, fund managers, retail investors and other users.
Educational efforts
As part of our educational efforts, the Exchange together with the SIDC and a local university collaborated to facilitate the incorporation of SIDC’s derivatives module into the university’s degree programmes. The module has been approved for inclusion in the university’s finance and banking related degree programme, with the first intake to be admitted in 2012. This initiative of bringing talent into the Derivativesmarket cannot have taken place at a better time, as a pipeline of talent and sales personnel are critical to leverage on the momentum gained and achieve the growth potential for derivatives as envisaged by the second Capital Market Master Plan.
Islamic Markets
In the year under review our focus was on expanding our client base in support of our mission to promote Bursa Malaysia as an international Islamic fund-raising centre. Our attention was directed towards both Bursa Suq Al-Sila’ (BSAS) and capital markets through Sukuk Listings. BSAS progressed quite aggressively with 22 new members in 2011 (15 local and 7 foreign participants) with an ADV of RM1.2 billion daily.
On the capital markets front, Bursa Malaysia retained its leadership position for the third consecutive year, as the premier Sukuk listing destination with 19 programmes by 17 issuers totalling USD29 billion Sukuk programmes listed. In July 2011, we welcomed the largest dualtranche global sovereign USD Sukuk by Wakala Global Sukuk Berhad on the Exchange. In addition to the listing, we also facilitated the issuance of 10 Sukuk and Term Notes this year on BSAS.
Bursa believes that Islamic markets present great potential because of Malaysia’s leadership in global Islamic financial products and services. As such, investments in human capital and other resources are being undertaken in preparation to seize the opportunities in the future.
Bond Secondary Market
On the secondary market, over-the-counter trading remained the bond trading preference. Thus there were no online trading activities via the Order Matching and Negotiation module of the Electronic Trading Platform for 2011.
The Labuan International Islamic Exchange
LFX recorded five new listings in 2011, bringing the total number of listed instruments to 30. The most significant listing was the USD 2.0 billion Wakala Global Sukuk Berhad issued by the Malaysian Government, which was listed on 7 July 2011. The market capitalisation of the LFX stood at USD18.98 billion at year end 2011.
LFX
2011
2010
Movement
Market Capitalisation (USD billion)
No. of Listed Instruments