|
Market Highlights
|
| 31 DEC
2007 |
31 DEC
2008 |
31 DEC
2009 |
31 DEC
2010 |
31 DEC
2011 |
| Securities Market
| |
|
|
|
|
| KLCI/FBM KLCI
| 1,445.03 |
876.75 |
1,272.78 |
1,518.91 |
1,530.73 |
| Market Capitalisation (RM billion)
| 1,106 |
664 |
999 |
1275 |
1,285 |
| Velocity (%)
| 53 |
34 |
34 |
33 |
33 |
| Average Daily Volume – OMT & DBT (million shares)
| 1,548 |
631 |
1,000 |
1,021 |
1,344 |
| Average Daily Volume – OMT (million shares)
| 1,457 |
576 |
945 |
953 |
1,288 |
| Average Daily Value – OMT & DBT (RM million)
| 2,346 |
1,278 |
1,221 |
1,574 |
1,788 |
| Average Daily Value – OMT (RM million)
| 2,179 |
1,181 |
1,129 |
1,454 |
1,699 |
| Total Trading Volume – OMT & DBT (billion shares)
| 384 |
154 |
248 |
253 |
329 |
| Total Trading Value – OMT & DBT (RM billion)
| 582 |
313 |
303 |
390 |
438 |
| Total Funds Raised (RM billion)
| 10.6 |
6.1 |
27.8 |
33.0 |
15.0 |
| New Listings – IPOs (including REITs)
| 26 |
23 |
14 |
29 |
28 |
| New Listings – ETFs
| 1 |
1 |
0 |
2 |
0 |
| New Listings – Structured Warrants
| 154 |
81 |
124 |
204 |
363 |
| No. of ISS Instructions Cleared and Settled (’000)
| 444 |
389 |
326 |
369 |
493 |
| No. of PLCs
| 987 |
977 |
960 |
957 |
941 |
| No. of Listed REITs
| 13 |
13 |
12 |
14 |
15 |
| No. of Listed ETFs
| 2 |
3 |
3 |
5 |
5 |
| No. of Listed Structured Warrants
| 120 |
48 |
137 |
225 |
304 |
| No. of Rights & Bonus Issues
| 137 |
132 |
52 |
77 |
61 |
| No. of New CDS Accounts | 190,864 |
157,687 |
161,100 |
157,911 |
164,110 |
| Total CDS Accounts (million)
| 3.8 |
3.9 |
4.0 |
4.1 |
4.2 |
| No. of Trading Days
| 248 |
245 |
248 |
248 |
245 |
| No. of Participating Organisations of Bursa Malaysia Securities
| 34 |
34 |
34 |
35 |
35 |
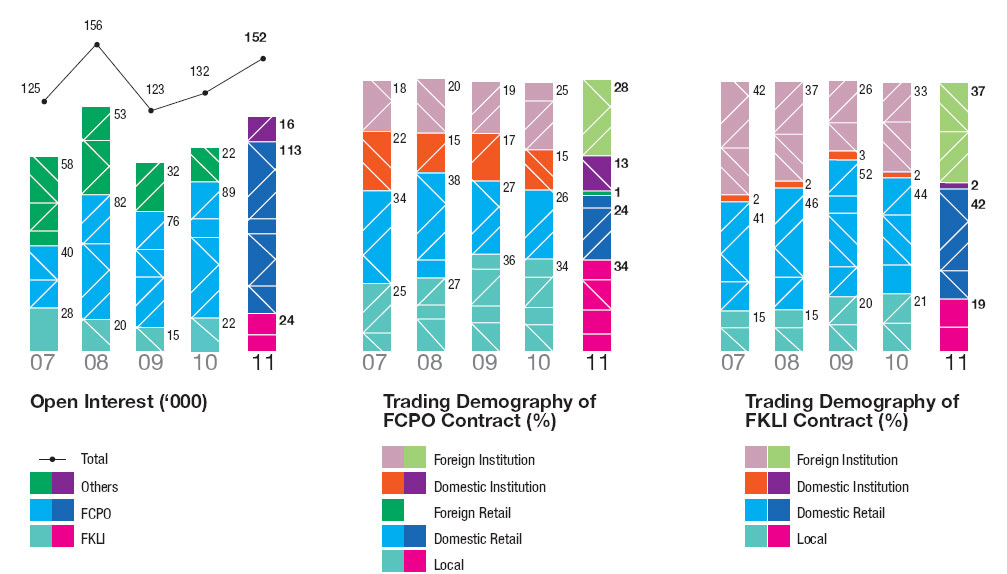
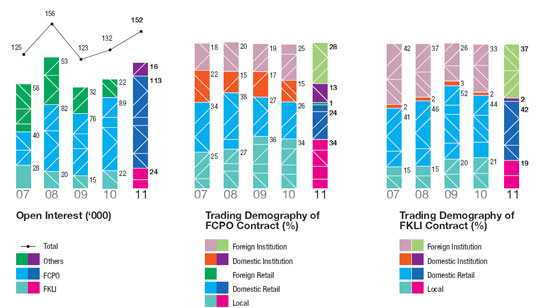
| Derivatives Market
| |
|
|
|
|
| Open Interest
| 125,051 |
155,560 |
123,141 |
132,151 |
152,419 |
| No. of Contracts Traded:
| |
|
|
|
|
- Crude Palm Oil Futures (million)
| 2.8 |
3.0 |
4.0 |
4.1 |
5.9 |
|
| 3.2 |
2.9 |
2.0 |
2.0 |
2.5 |
|
| 239,314 |
195,193 |
126,690 |
95,477 |
92,775 |
| Daily Average No. of Contracts Traded
| 25,011 |
24,878 |
24,749 |
24,818 |
34,474 |
| Total Contracts Traded (million)
| 6.2 |
6.1 |
6.1 |
6.2 |
8.4 |
| No. of Trading Participants of Bursa Malaysia Derivatives
| 17 |
20 |
19 |
20 |
20 |
| Islamic Market
| |
|
|
|
|
| No. of Sukuk Listings on Bursa Malaysia Securities*
| - |
- |
12 |
19 |
19 |
| Value of Sukuk Listings (USD billion)
| - |
- |
17.6 |
27.7 |
28.5 |
| % of Shari’ah Compliant (by number of companies):
|
|
|
|
|
|
|
|
86 |
87 |
88 |
88 |
89 |
| % of Shari’ah Compliant
(by market capitalisation):
| |
|
|
|
|
|
| 64 |
64 |
64 |
63 |
63 |
|
| - |
49 |
56 |
51 |
40 |
|
| 26 |
30 |
35 |
22 |
18 |
| Bursa Suq Al-Sila’^:
| |
|
|
|
|
- Daily Average Value Commodity Traded (RM million)
| - |
- |
69.6 |
351.0 |
1,218.6 |
- Total Value Commodity Traded (RM million)
| - |
- |
6,472.3 |
90,219.0 |
298,551.0 |
- Total no. of Matched Contracts
| - |
- |
370 |
2,273 |
9,106 |
|
| - |
- |
93 |
257 |
245 |
- No. of Trading Participants
| - |
- |
16 |
33 |
55 |
|
| |
|
* Sukuk listing was introduced in December 2008
^ Bursa Suq Al-Sila' was launched in August 2009
|
Click on the image to view a larger version.
|
|
|
Derivatives Market
Click on the image to view a larger version.
|
|
 |
|
|
|