|
Our Performance
5 Year Highlights
|
| 31 DEC
2007 |
31 DEC
2008 |
31 DEC
2009 |
31 DEC
2010 |
31 DEC
2011 |
Key Results
(RM Million) | |
|
|
|
|
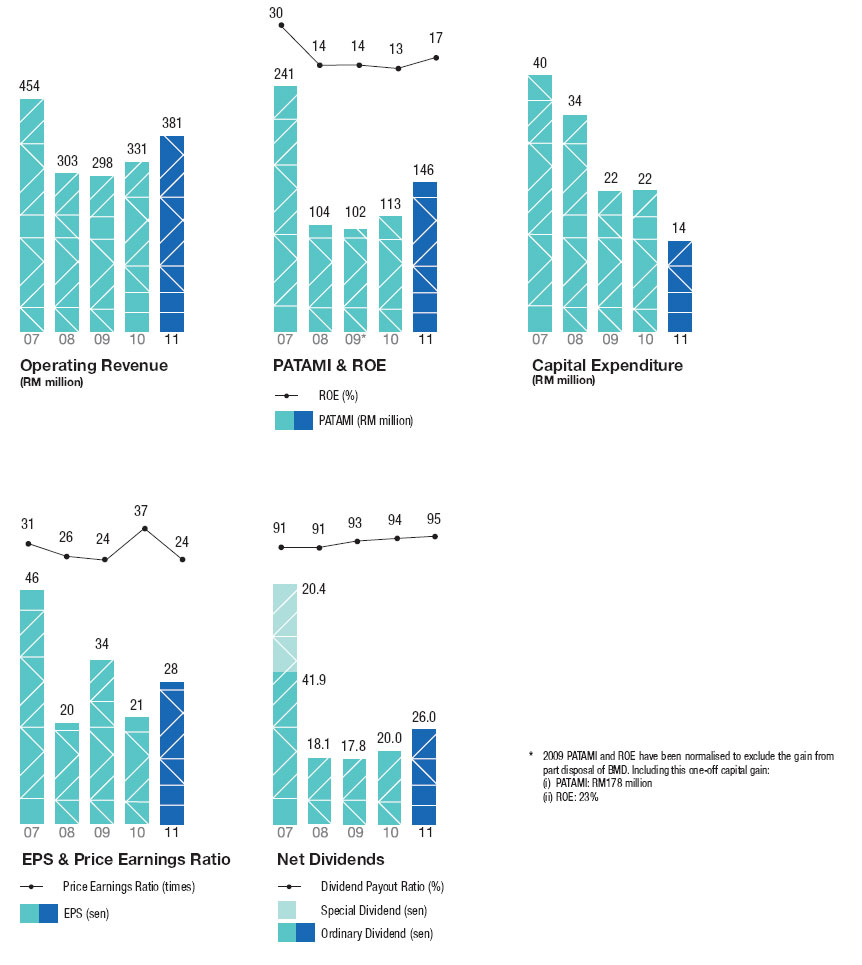
| Operating Revenue1
| 453.5 |
302.5 |
297.8 |
331.3 |
381.3 |
| Operating Expenses2
| 172.9 |
186.0 |
183.2 |
197.3 |
214.0 |
| PATAMI
| 240.6 |
104.4 |
177.64 |
113.0 |
146.2 |
|
| |
|
|
|
|
Other Key Data
(RM Million)
| |
|
|
|
|
| Total Assets
| 1,447.0 |
1,729.9 |
1,786.6 |
1,708.3 |
1,673.5 |
| Total Liabilities
| 666.8 |
997.6 |
938.0 |
844.7 |
798.9 |
| Shareholders' Equity
| 780.2 |
732.3 |
840.0 |
852.3 |
860.4 |
| Capital Expenditure
| 39.9 |
34.0 |
22.1 |
21.9 |
13.6 |
| Cash from Operating Activities3
| 234.3 |
92.9 |
118.9 |
153.9 |
177.0 |
|
| |
|
|
|
|
| Financial Ratios (%)
| |
|
|
|
|
| Operating Revenue Growth1
| 68.5 |
(33.3) |
(1.5) |
11.2 |
15.1 |
| Cost to Income Ratio
| 35.2 |
56.1 |
45.54 |
54.6 |
50.9 |
| Net Profit Margin
| 48.9 |
31.5 |
44.14 |
32.0 |
36.0 |
| ROE
| 30.3 |
13.8 |
22.64 |
13.4 |
17.1 |
|
| |
|
|
|
|
| Share Information
| |
|
|
|
|
| Basic EPS (sen)
| 46.11 |
19.89 |
33.70 |
21.29 |
27.50 |
| Net Dividends per Share (sen)
| 62.30 |
18.06 |
17.83 |
20.00 |
26.00 |
| Net Assets per Share (sen)
| 1.49 |
1.39 |
1.59 |
1.60 |
1.62 |
| Share Price - High (RM)
| 16.90 |
16.30 |
8.59 |
8.66 |
9.02 |
| Share Price - Low (RM)
| 8.00 |
4.68 |
4.36 |
6.75 |
5.76 |
| Share Price as at 31 December (RM)
| 14.30 |
5.15 |
7.99 |
7.80 |
6.70 |
| Price Earnings Ratio (times)
| 31.01 |
25.89 |
23.71 |
36.64 |
24.36 |
| Company Market Capitalisation (RM billion)
| 7.49 |
2.71 |
4.22 |
4.14 |
3.56 |
|
| |
|
1 Comparative figures have been restated to include interest earned from participants' contributions and conference fees and exhibition related income.
2 Comparative figures have been restated to include commitment fees.
3 Comparative figures have been restated to exclude participants' contributions and collaterals.
4 The results and ratios for 2009 which exclude the gain on part disposal of a subsidiary are as follows:
(i) PATAMI: RM101.6 million
(ii) Cost to income ratio: 56.1%
(iii) Net profit margin: 31.1%
(iv) ROE: 13.6% |
Click on the image to view a larger version.
|
|

|
Click on the image to view a larger version.
|
|
 |
| |
Quarterly Results
|
|
|
1st quarter |
2nd quarter |
3rd quarter |
4th quarter |
Full year |
| 2011 |
|
|
|
|
|
| Key Financials |
|
|
|
|
|
| Operating Revenue (RM million) |
107.8 |
92.5 |
96.1 |
84.9 |
381.3 |
| PATAMI (RM million) |
40.5 |
35.7 |
38.6 |
31.3 |
146.2 |
| ROE (%) |
18.6 |
16.3 |
18.2 |
14.9 |
17.1 |
| Cost to Income Ratio (%) |
49.9 |
51.1 |
49.5 |
53.7 |
50.9 |
| Earnings per Share (sen) |
7.6 |
6.7 |
7.3 |
5.9 |
27.5 |
| Dividend per Share (sen) |
- |
13.0 |
– |
13.0 |
26.0 |
| |
|
|
|
|
|
| Key Operating Drivers |
|
|
|
|
|
| ADV - OMT & DBT on Securities Market (RM million) |
2,234 |
1,639 |
1,887 |
1,412 |
1,788 |
| ADC on Derivatives Market |
36,785 |
32,316 |
34,169 |
34,779 |
34,474 |
| |
|
|
|
|
|
| |
|
|
|
|
|
| |
|
|
|
|
|
| 2010 |
|
|
|
|
|
| Key Financials |
|
|
|
|
|
| Operating Revenue (RM million) |
81.2 |
76.5 |
79.3 |
94.3 |
331.3 |
| PATAMI (RM million) |
28.1 |
27.5 |
27.7 |
29.8 |
113.0 |
| ROE (%) |
13.1 |
12.9 |
13.4 |
14.3 |
13.4 |
| Cost to Income Ratio (%) |
55.1 |
54.2 |
55.3 |
54.1 |
54.6 |
| Earnings per Share (sen) |
5.3 |
5.2 |
5.2 |
5.6 |
21.3 |
| Dividend per Share (sen) |
– |
9.5 |
– |
10.5 |
20.0 |
| |
|
|
|
|
|
| Key Operating Drivers |
|
|
|
|
|
| ADV - OMT & DBT on Securities Market (RM million) |
1,532 |
1,288 |
1,482 |
2,002 |
1,574 |
| ADC on Derivatives Market |
23,889 |
22,518 |
25,111 |
27,776 |
24,818 |
| |
|
|
|
|
|
|
Click on the image to view a larger version.
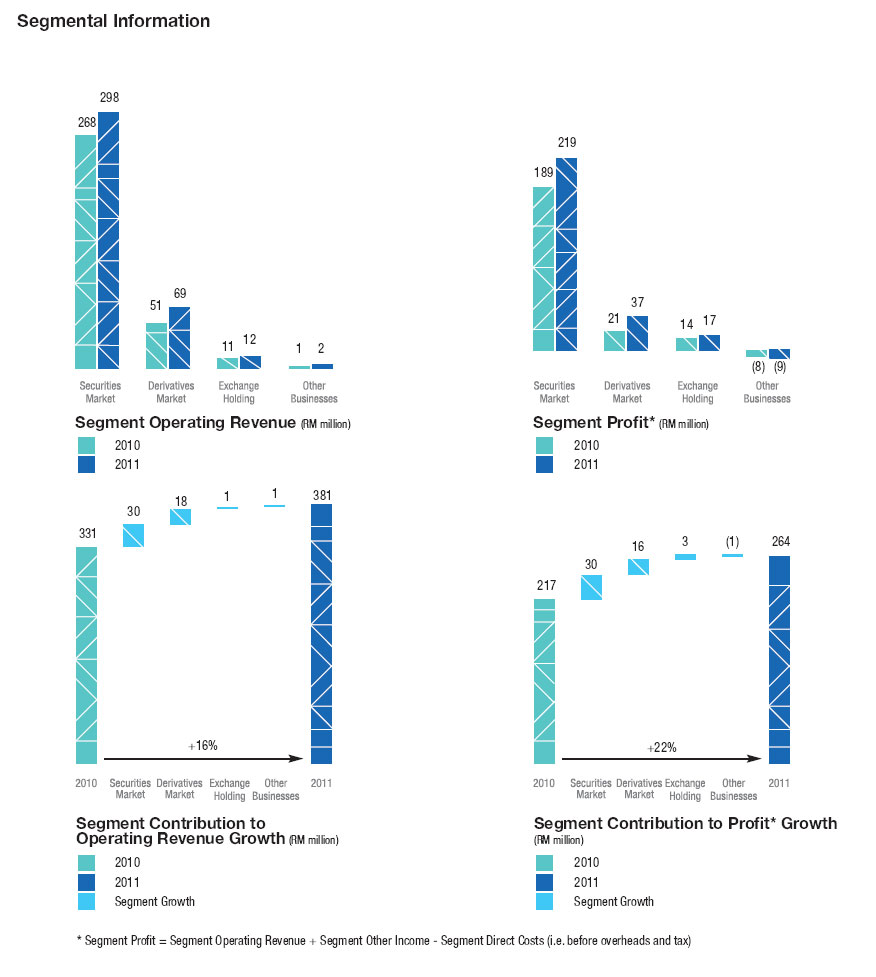
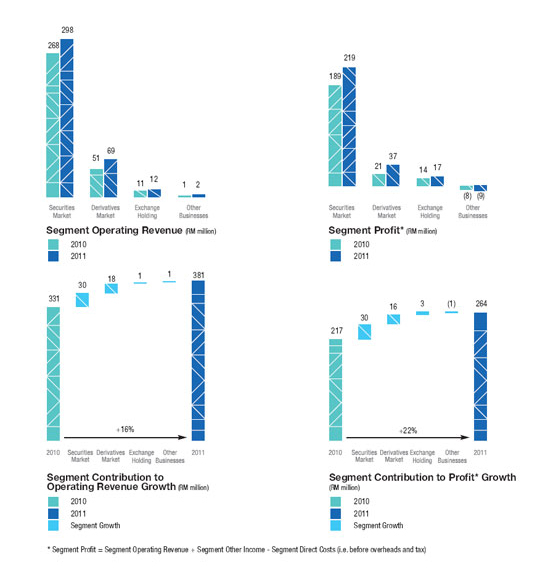
Segmental Information |
 |
|
|
|