|
OUR PERFORMANCE
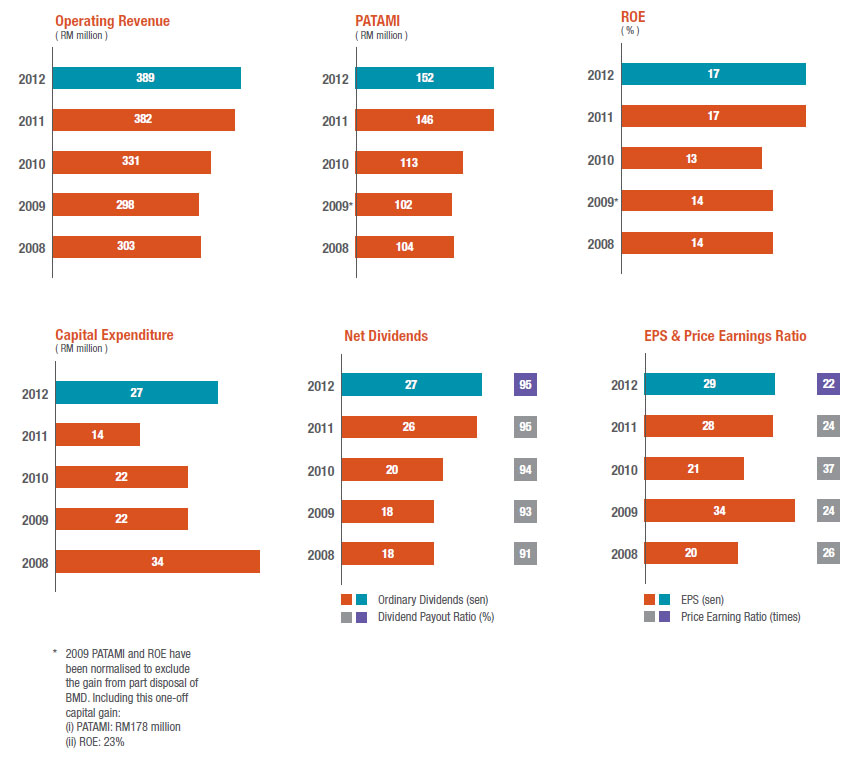
5 Year Highlights
|
| 31 DEC
2008 |
31 DEC
2009 |
31 DEC
2010 |
31 DEC
2011 |
31 DEC
2012 |
Key Results
(RM Million)
| |
|
|
|
|
| Operating Revenue1
| 302.5 |
297.8 |
331.3 |
381.3 |
388.5 |
| Operating Expenses2
| 186.0 |
183.2 |
197.3 |
214.0 |
211.1 |
| PATAMI
| 104.4 |
177.63 |
113.0 |
146.2 |
151.5 |
|
| |
|
|
|
|
Other Key Data
(RM Million)
| |
|
|
|
|
| Total Assets
| 1,729.9 |
1,786.6 |
1,708.3 |
1,673.5 |
2,198.4 |
| Total Liabilities
| 997.6 |
938.0 |
844.7 |
798.9 |
1,307.2 |
| Shareholders' Equity
| 732.3 |
840.0 |
852.3 |
860.4 |
875.5 |
| Capital Expenditure
| 34.0 |
22.1 |
21.9 |
13.6 |
26.7 |
|
| |
|
|
|
|
| Financial Ratios (%)
| |
|
|
|
|
| Operating Revenue Growth1
| (33.3) |
(1.5) |
11.2 |
15.1 |
1.8 |
| Cost to Income Ratio
| 56.1 |
45.53 |
54.6 |
50.9 |
49.4 |
| Net Profit Margin
| 31.5 |
44.13 |
32.0 |
36.0 |
36.9 |
| ROE
| 13.8 |
22.63 |
13.4 |
17.1 |
17.4 |
|
| |
|
|
|
|
| Share Information
| |
|
|
|
|
| Basic EPS (sen)
| 19.9 |
33.7 |
21.3 |
27.5 |
28.5 |
| Net Dividends per Share (sen)
| 18.1 |
17.8 |
20.0 |
26.0 |
27.0 |
| Payout Ratio (%)
| 90.9 |
92.9 |
94.0 |
94.6 |
94.8 |
| Net Assets per Share (sen)
| 1.39 |
1.59 |
1.60 |
1.62 |
1.65 |
| Share Price - High (RM)
| 16.30 |
8.59 |
8.66 |
9.02 |
7.72 |
| Share Price - Low (RM)
| 4.68 |
4.36 |
6.75 |
5.76 |
5.91 |
| Share Price as at 31 December (RM)
| 5.15 |
7.99 |
7.80 |
6.70 |
6.22 |
| Price Earnings Ratio (times)
| 26 |
24 |
37 |
24 |
22 |
| Company Market Capitalisation (RM billion)
| 2.7 |
4.2 |
4.1 |
3.6 |
3.3 |
|
| |
|
| |
1 Comparative figures have been restated to include administration fees and conference fees and exhibition related income.
2 Comparative figures have been restated to include commitment fees.
3 The results and ratios for 2009 which exclude the gain on disposal of a subsidiary are as follows:
| |
(i)
(ii)
(iii)
(iv) |
PATAMI: RM101.6 million
Cost to income ratio: 56.1%
Net profit margin: 31.1%
ROE: 13.6% |
|
| |
|
Click on the image to view a larger version.
|
|

|
| |
Quarterly Results
|
|
|
1st quarter |
2nd quarter |
3rd quarter |
4th quarter |
Full year |
| 2012 |
|
|
|
|
|
| Key Financials |
|
|
|
|
|
| Operating Revenue (RM million) |
100.5 |
96.8 |
96.7 |
94.5 |
388.5 |
| PATAMI (RM million) |
40.9 |
37.9 |
37.0 |
35.7 |
151.35 |
| ROE (%) |
18.4 |
17.0 |
17.2 |
16.6 |
17.4 |
| Cost to Income Ratio (%) |
47.7 |
49.3 |
48.7 |
52.1 |
49.4 |
| Earnings per Share (sen) |
7.7 |
7.1 |
7.0 |
6.7 |
28.5 |
| Dividend per Share (sen) |
- |
13.5 |
- |
13.5 |
27.0 |
| |
|
|
|
|
|
| Key Operating Drivers |
|
|
|
|
|
| ADV - OMT & DBT on Securities Market (RM million) |
1,973 |
1,517 |
1,684 |
1,509 |
1,666 |
| ADC on Derivatives Market |
31,015 |
40,367 |
42,234 |
43,555 |
39,387 |
| |
|
|
|
|
|
| |
|
|
|
|
|
| |
|
|
|
|
|
| 2011 |
|
|
|
|
|
| Key Financials |
|
|
|
|
|
| Operating Revenue (RM million) |
107.9 |
92.5 |
96.1 |
85.0 |
381.5 |
| PATAMI (RM million) |
40.5 |
35.8 |
38.6 |
31.3 |
146.2 |
| ROE (%) |
18.6 |
16.3 |
18.2 |
14.9 |
17.1 |
| Cost to Income Ratio (%) |
49.9 |
51.1 |
49.5 |
53.7 |
50.9 |
| Earnings per Share (sen) |
7.6 |
6.7 |
7.3 |
5.9 |
27.5 |
| Dividend per Share (sen) |
- |
13.0 |
– |
13.0 |
26.0 |
| |
|
|
|
|
|
| Key Operating Drivers |
|
|
|
|
|
| ADV - OMT & DBT on Securities Market (RM million) |
2,234 |
1,639 |
1,887 |
1,412 |
1,788 |
| ADC on Derivatives Market |
36,785 |
32,316 |
34,169 |
34,779 |
34,474 |
| |
|
|
|
|
|
|
|
|
|