|
| 31 DEC 2006 |
31 DEC 2007 |
31 DEC 2008 |
31 DEC 2009 |
31 DEC 2010 |
| Key Results (RM Million)
| |
|
|
|
|
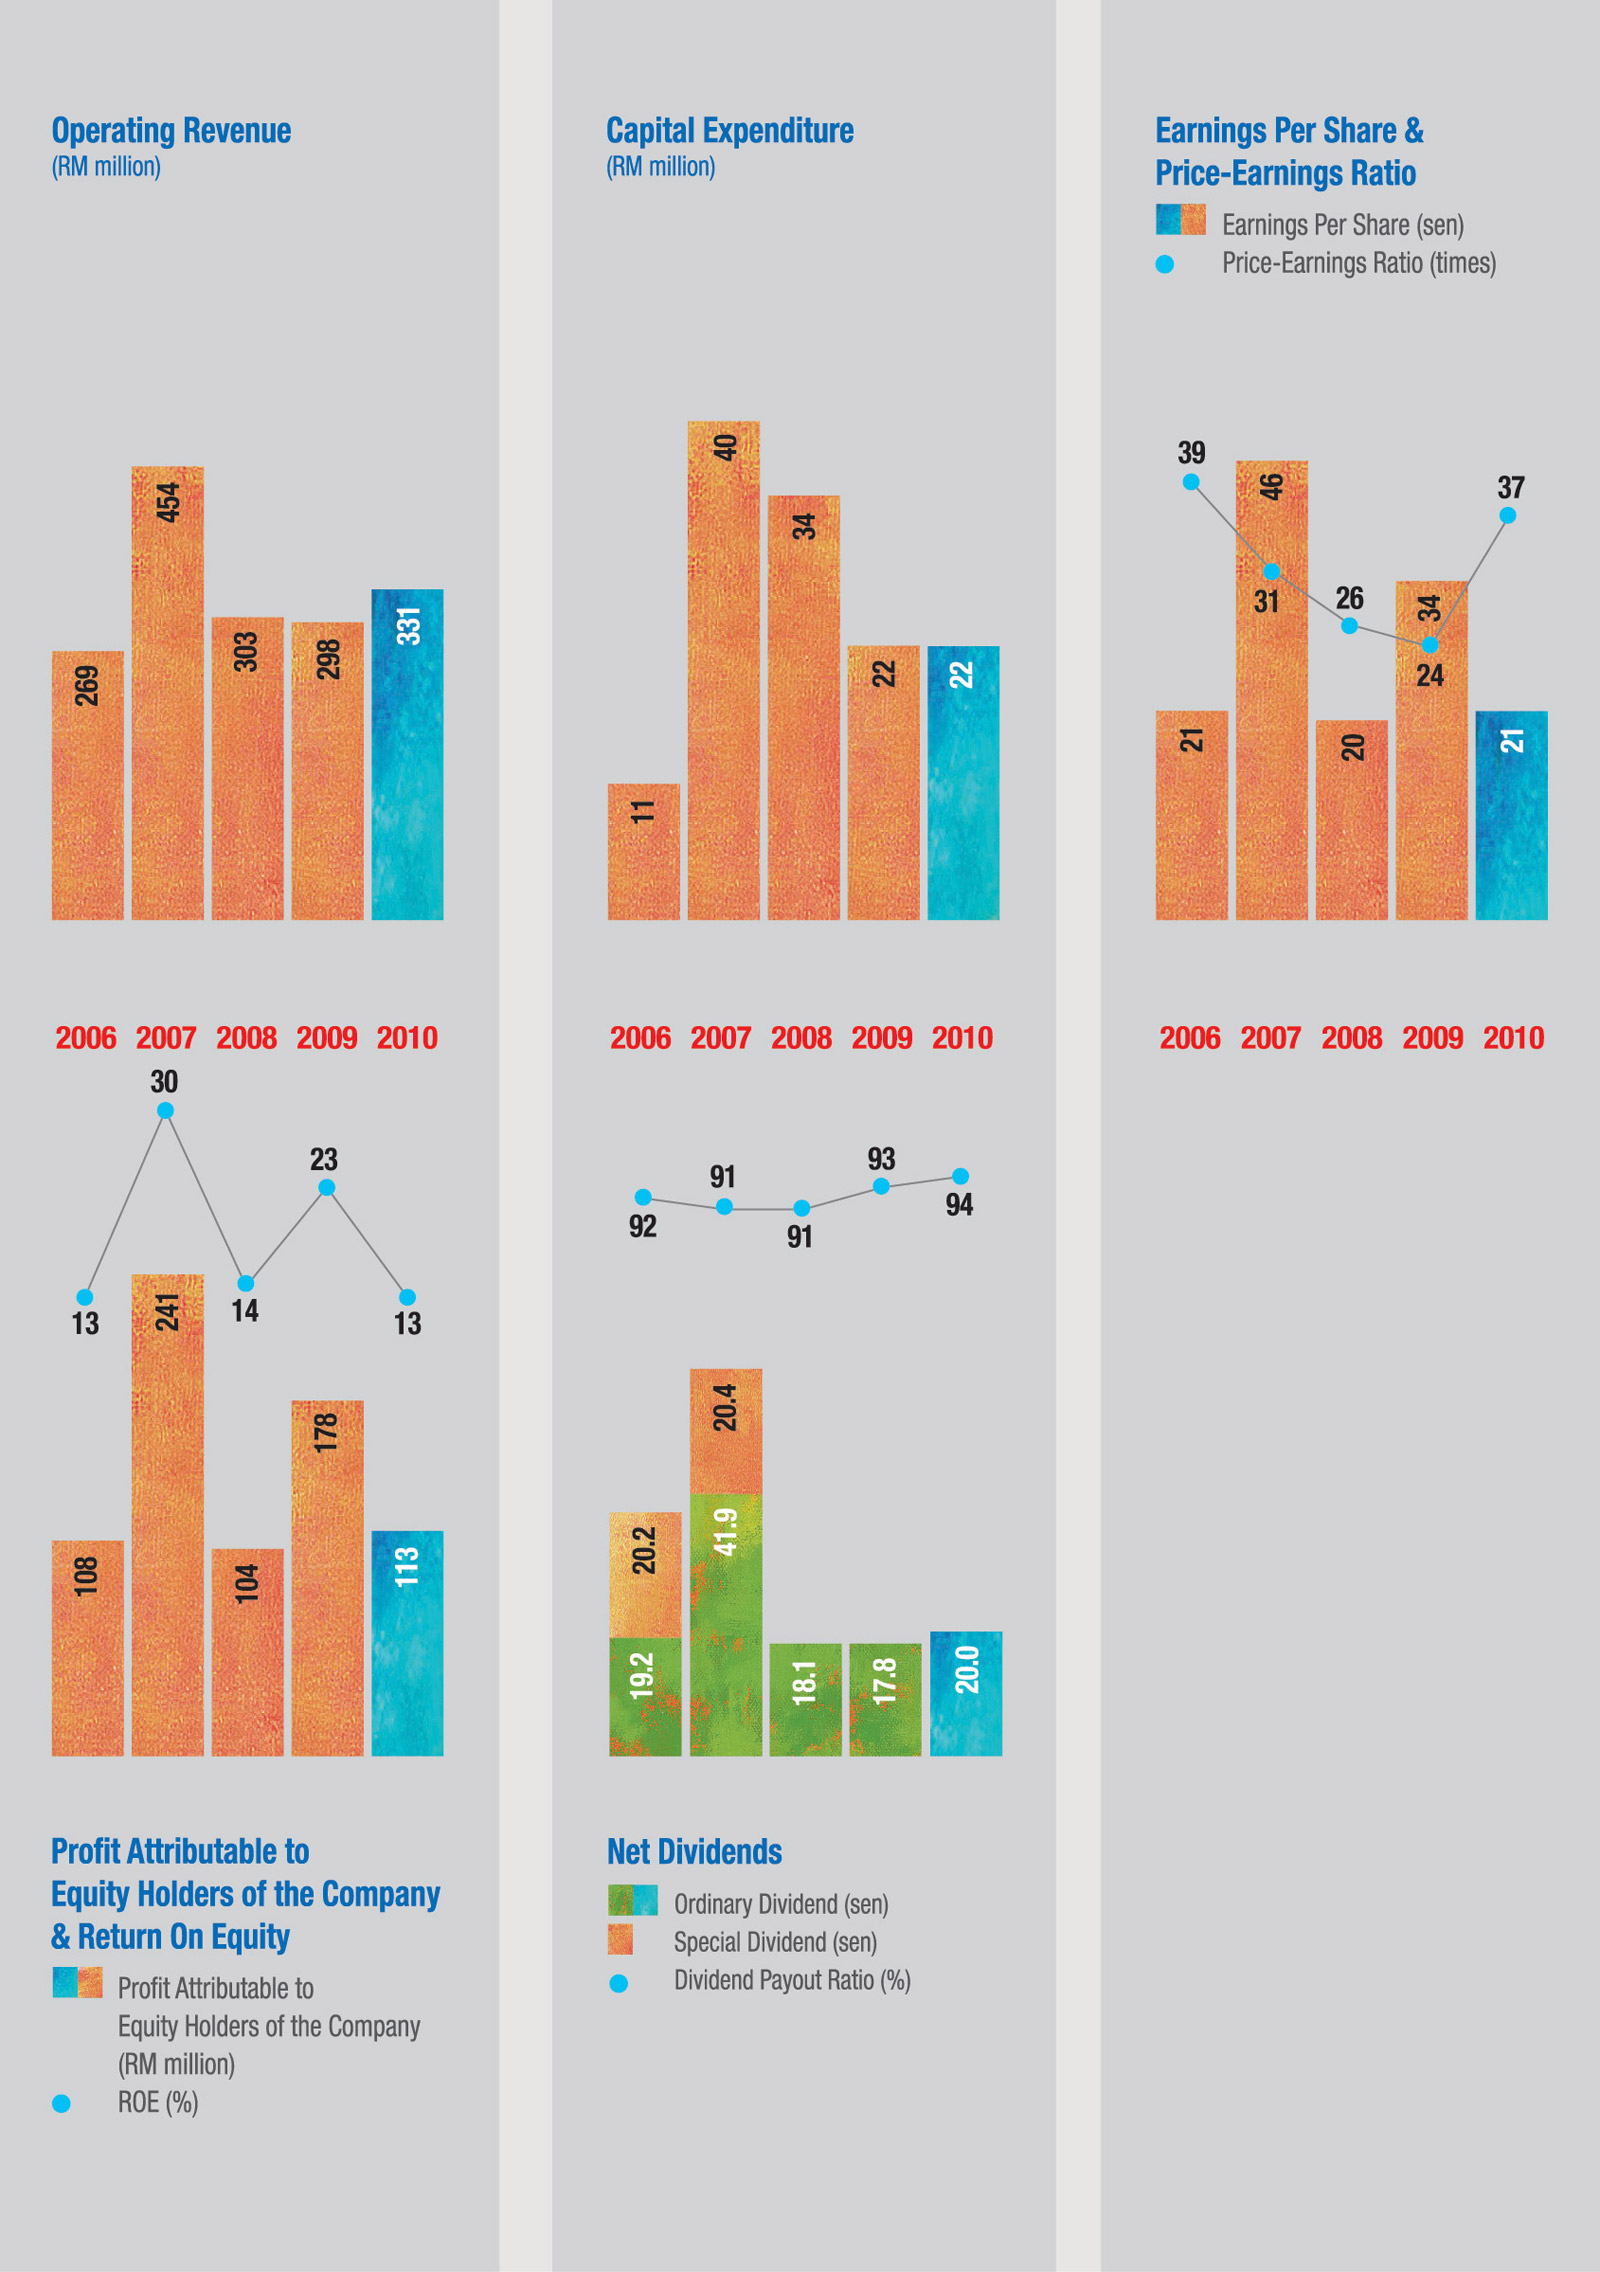
| Operating Revenue1 |
269.1 |
453.5 |
302.5 |
297.8 |
331.3 |
| Operating Expenses
| 148.4 |
172.3 |
185.4 |
182.6 |
196.7 |
| Operating EBITDA1
| 136.7 |
295.2 |
137.6 |
154.1 |
177.8 |
| Profit Attributable to Equity Holders of the Company
| 108.1 |
240.6 |
104.4 |
177.63 |
113.0 |
| Other Key Data (RM Million)
| |
|
|
|
|
| Total Assets
| 1,407.4 |
1,447.0 |
1,729.9 |
1,786.6 |
1,708.3 |
| Total Liabilities
| 598.0 |
666.8 |
997.6 |
938.0 |
844.7 |
| Shareholders' Funds
| 809.4 |
780.2 |
732.3 |
840.0 |
852.3 |
| Capital Expenditure
| 10.5 |
39.9 |
34.0 |
22.1 |
21.9 |
| Cash from Operating Activities2
| 122.1 |
234.3 |
92.9 |
118.9 |
153.9 |
| Financial Ratios (%)
| |
|
|
|
|
| Operating Revenue Growth1
| 36.6 |
68.5 |
(33.3) |
(1.5) |
11.2 |
| Derivatives Trading and Stable Revenue to Operating Expenses
| 73.3 |
80.4 |
79.2 |
77.8 |
74.0 |
| Operating EBITDA Margin1
| 50.8 |
65.1 |
45.5 |
51.7 |
53.7 |
| Net Profit Margin
| 35.8 |
48.9 |
31.5 |
44.13 |
32.0 |
| Return On Equity
| 12.8 |
30.3 |
13.8 |
22.63 |
13.4 |
| Share Information
| |
|
|
|
|
| Basic Earnings Per Share (sen)
| 20.94 |
46.11 |
19.89 |
33.70 |
21.29 |
| Net Dividends Per Share (sen)
| 39.38 |
62.30 |
18.06 |
17.83 |
20.00 |
| Net Assets Per Share (RM)
| 1.56 |
1.49 |
1.39 |
1.59 |
1.60 |
| Share Price – High (RM)
| 8.35 |
16.90 |
16.30 |
8.59 |
8.66 |
| Share Price – Low (RM)
| 3.66 |
8.00 |
4.68 |
4.36 |
6.75 |
| Share Price As At 31 December (RM)
| 8.05 |
14.30 |
5.15 |
7.99 |
7.80 |
| Price-Earnings Ratio (times)
| 39 |
31 |
26 |
24 |
37 |
| Company Market Capitalisation (RM billion)
| 4.18 |
7.49 |
2.71 |
4.22 |
4.14 |
|
| |
|