Bursa Malaysia • Annual Report 2013
4
The Year in Brief
Cost to Income Ratio
48.3
%
ROE
20.7
%
(
improved
3percentage
points
)
2012: 17.7%
EPS
32.5
sen
(+15%)
2012: 28.3 sen
RM439.8
million
(+13%)
2012: RM388.5 million
Operating Revenue
RM173.1
million
(+15%)
2012: RM150.6 million
PATAMI
(
improved
1percentage
point
)
2012: 49.3%
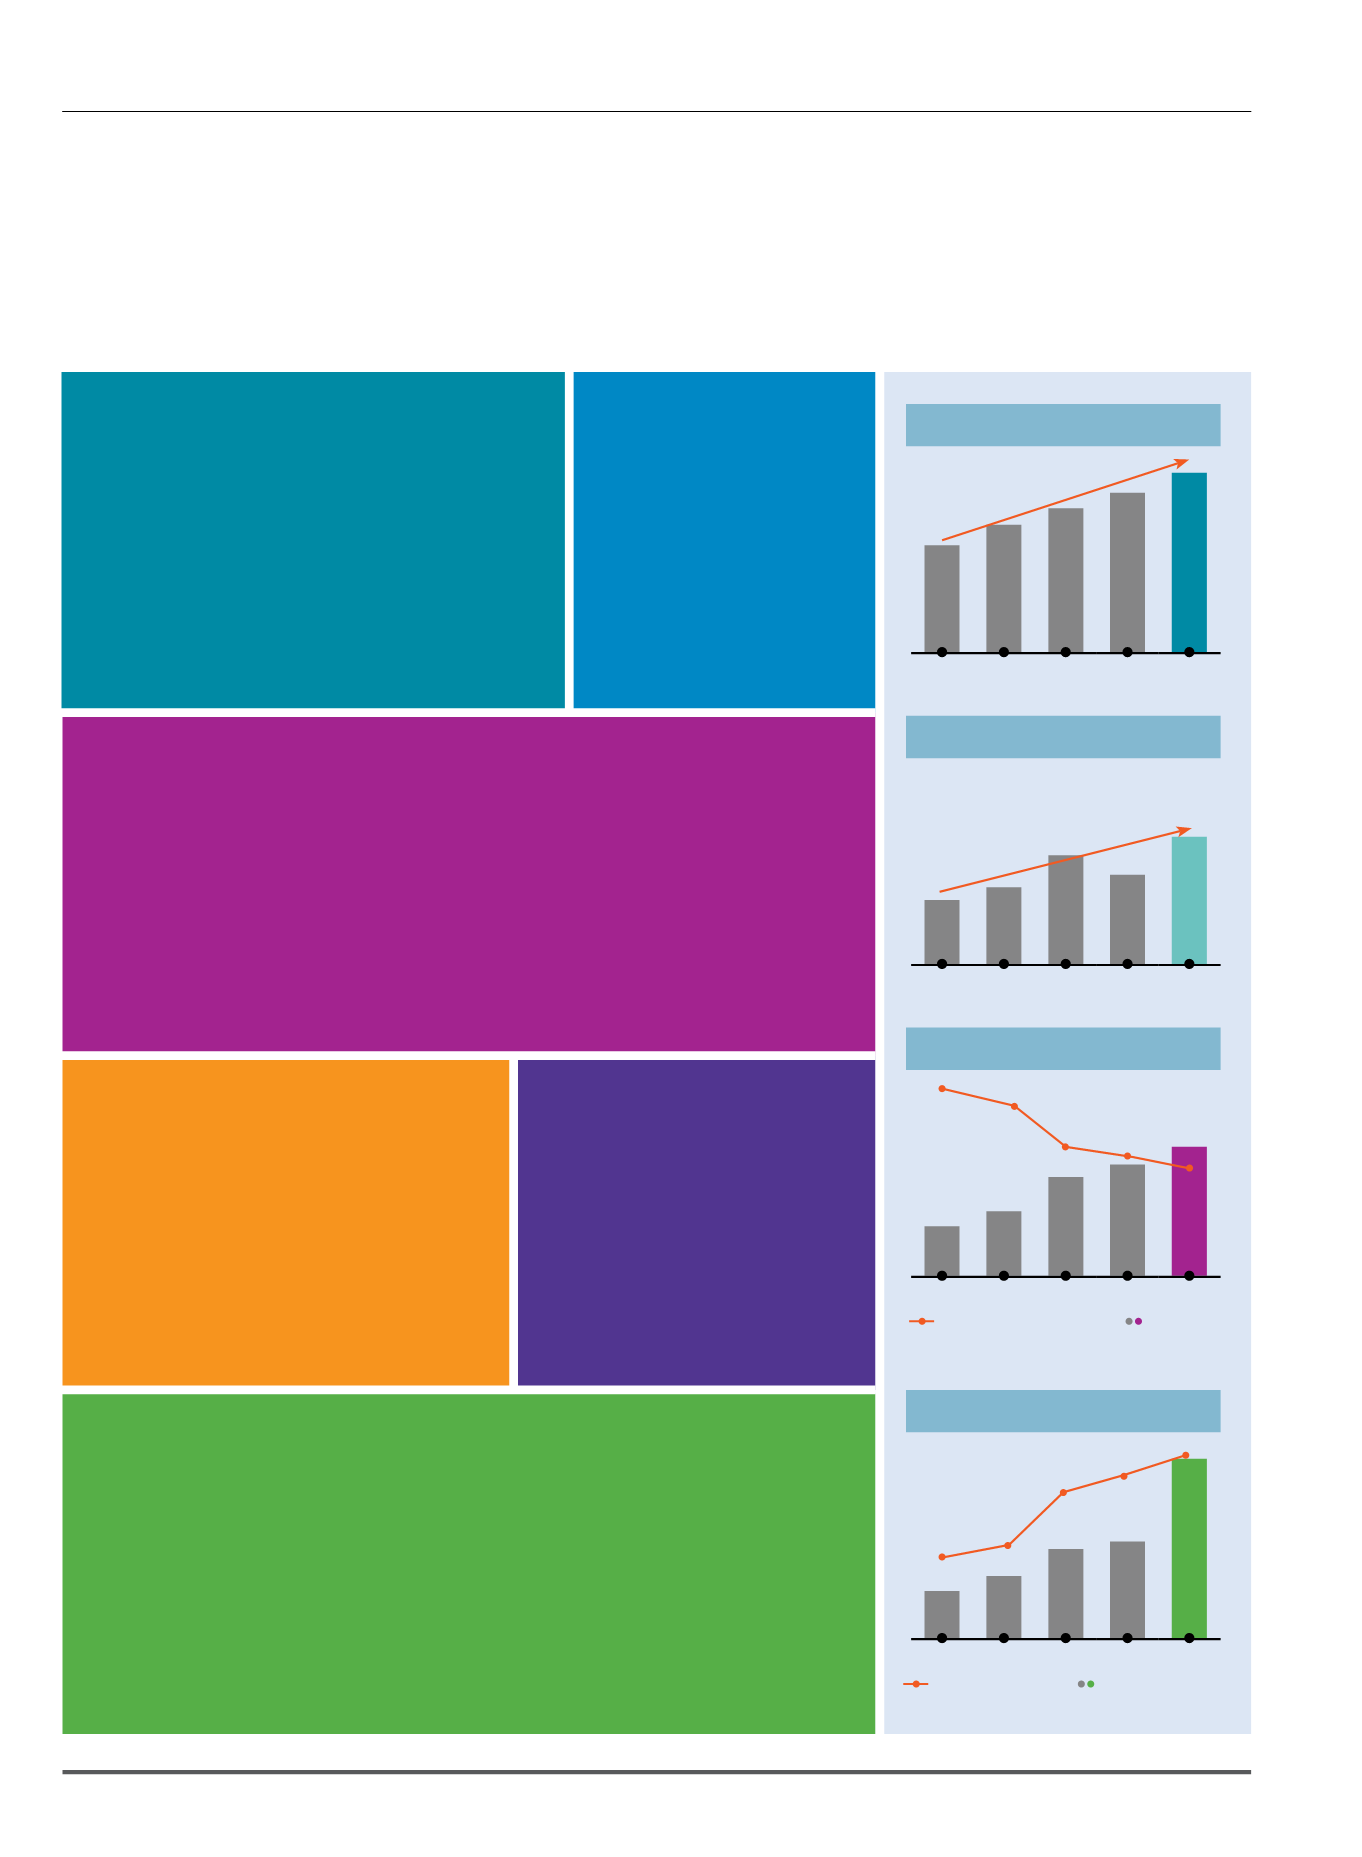
Financial Highlights
* CAGR: Compounded Annual Growth Rate
Operating Revenue (RMmillion)
2009 2010 2011 2012 2013
297.8
331.3
381.5
388.5
439.8
*CAGR: 10%
Operating Expenses (RMmillion)
2009 2010 2011 2012 2013
181.9
196.6
212.0
209.2
229.4
2.4 2.6
4.3
6.3
Net Dividend andDividendYield
2009 2010 2011 2012 2013
17.8
20.0
26.0
27.0
52.0
Dividend Yield (%)
Net Dividend (sen)
3.9
Net Dividend per Share
52
sen
(+93%)
PATAMI and Cost to Income Ratio
2009
1
2010 2011 2012 2013
98.6
56.5
54.7
51.1
49.3 48.3
111.9
143.1
150.6
173.1
Cost to Income Ratio
(%)
PATAMI
(RM million)
1
Excludes gain from part disposal of
Bursa Malaysia Derivatives Berhad Group
*CAGR: 6%
2012: 27 sen


