


 105 / 206

Bursa Malaysia
•
Annual Report 2014
93
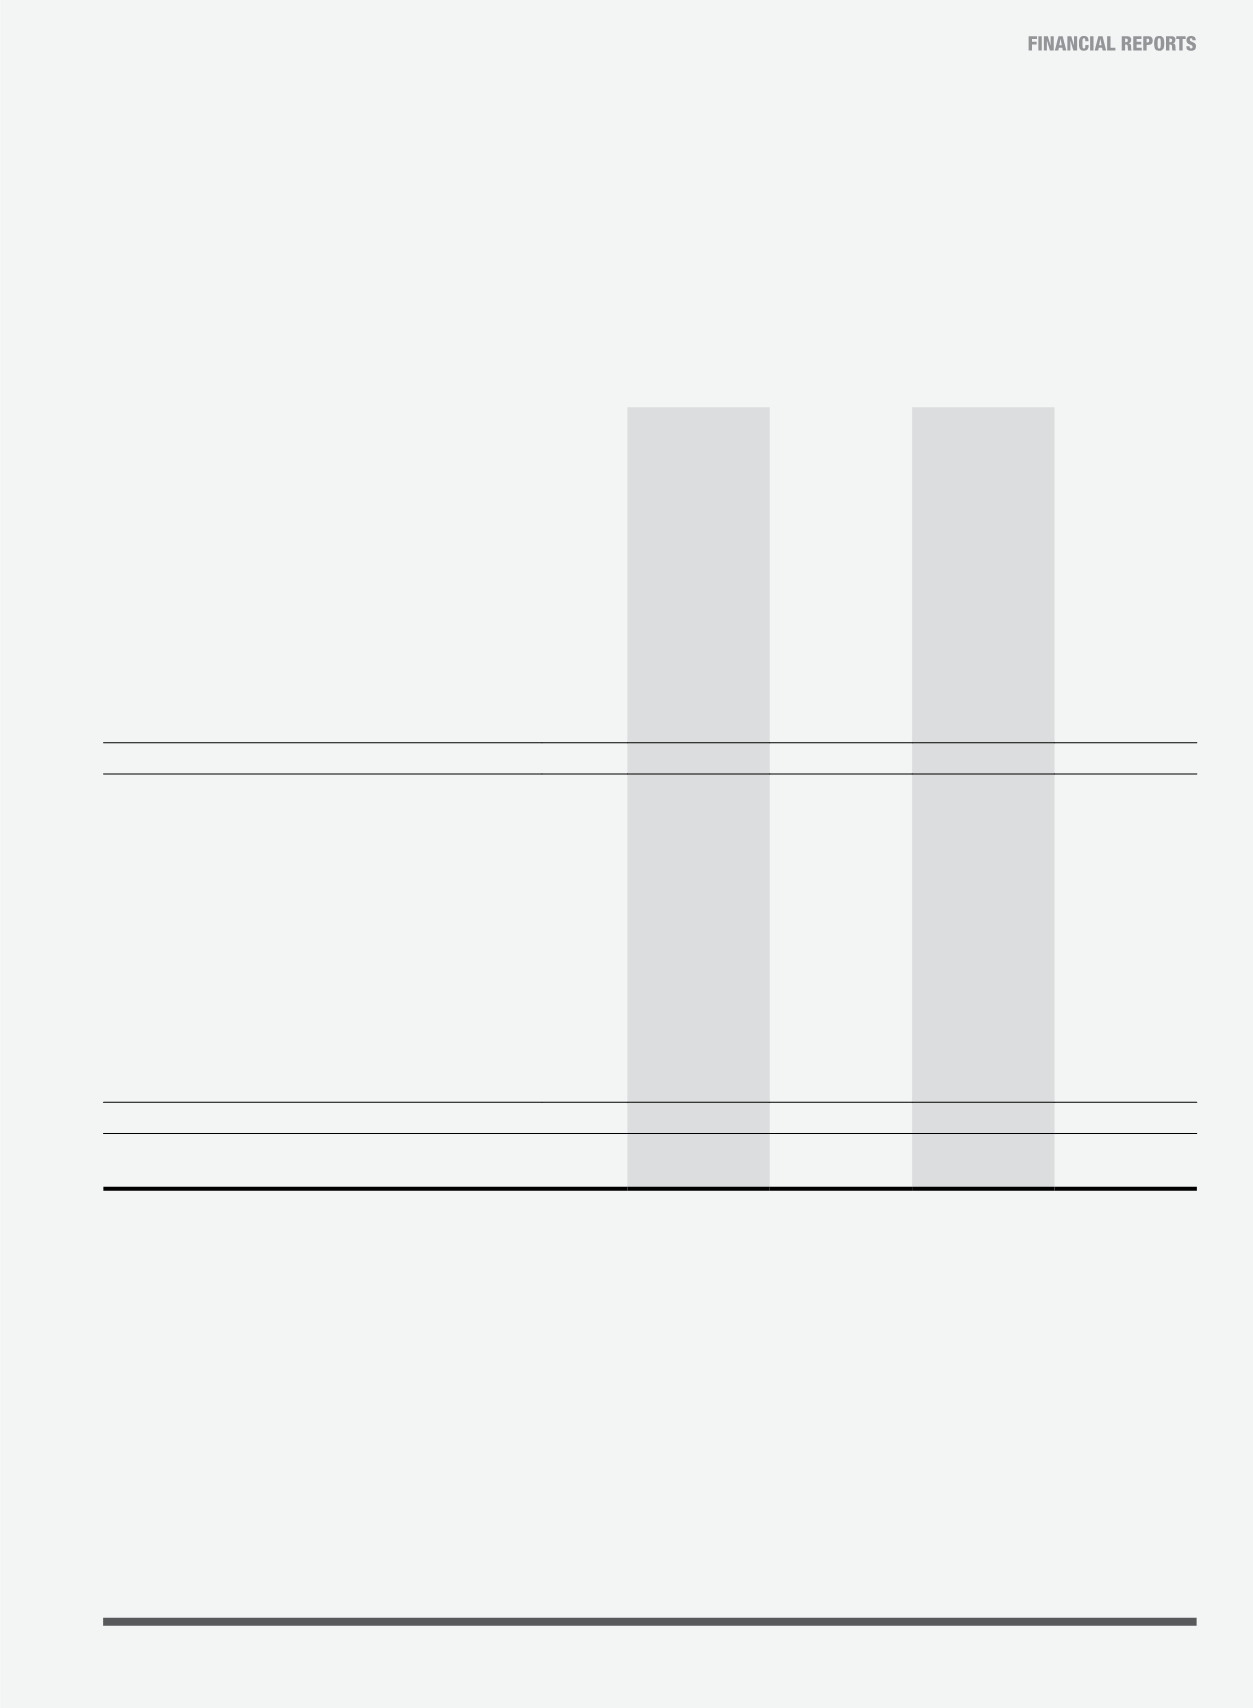
statements of financial position
As at 31 December 2014
Group
Company
Note
2014
2013
2014
2013
RM’000
RM’000
RM’000
RM’000
Assets
Non-current assets
Property, plant and equipment
12
197,264
206,356
196,061
203,872
Computer software
13
57,122
61,404
46,134
47,338
Goodwill
14
42,957
42,957
29,494
29,494
Investment in subsidiaries
15
-
-
152,142
152,142
Investment securities
16
188,449
163,495
118,631
98,584
Staff loans receivable
17
5,919
7,122
5,401
6,514
Deferred tax assets
18
3,673
1,648
-
-
495,384
482,982
547,863
537,944
Current assets
Trade receivables
19
41,289
32,733
938
1,286
Other receivables
20
17,412
15,794
13,517
11,884
Due from subsidiaries
21
-
-
32,847
30,682
Tax recoverable
2,721
6,612
2,746
6,612
Investment securities
16
41,916
51,183
31,928
36,268
Cash for trading margins, security deposits, Securities Borrowing
and Lending (SBL) collaterals and eDividend distributions
22
717,133
735,543
-
-
Cash and bank balances of Clearing Funds
23
126,261
65,374
-
-
Cash and bank balances of the Group/Company
24
214,367
351,442
56,651
144,759
1,161,099
1,258,681
138,627
231,491
Total assets
1,656,483
1,741,663
686,490
769,435