
THE YEAR IN BRIEF
Bursa Malaysia
•
Annual Report 2014
4
FINANCIAL HIGHLIGHTS
*CAGR: Compounded Annual Growth Rate
PATAMI
Net Dividend per Share
Operating Revenue
Cost to Income Ratio
46.1%
(Improved
2 percentage
points)
2013: 48.3%
54
sen
(+4%)
2013: 52 sen
(+7%)
2013: RM439.8 million
(Improved
5 percentage
points)
2013: 20.7%
25.4%
ROE
RM198.2
million
(+15%)
2013: RM173.1 million
EPS
37.2
sen
(+14%)
2013: 32.5 sen
RM471.3
million
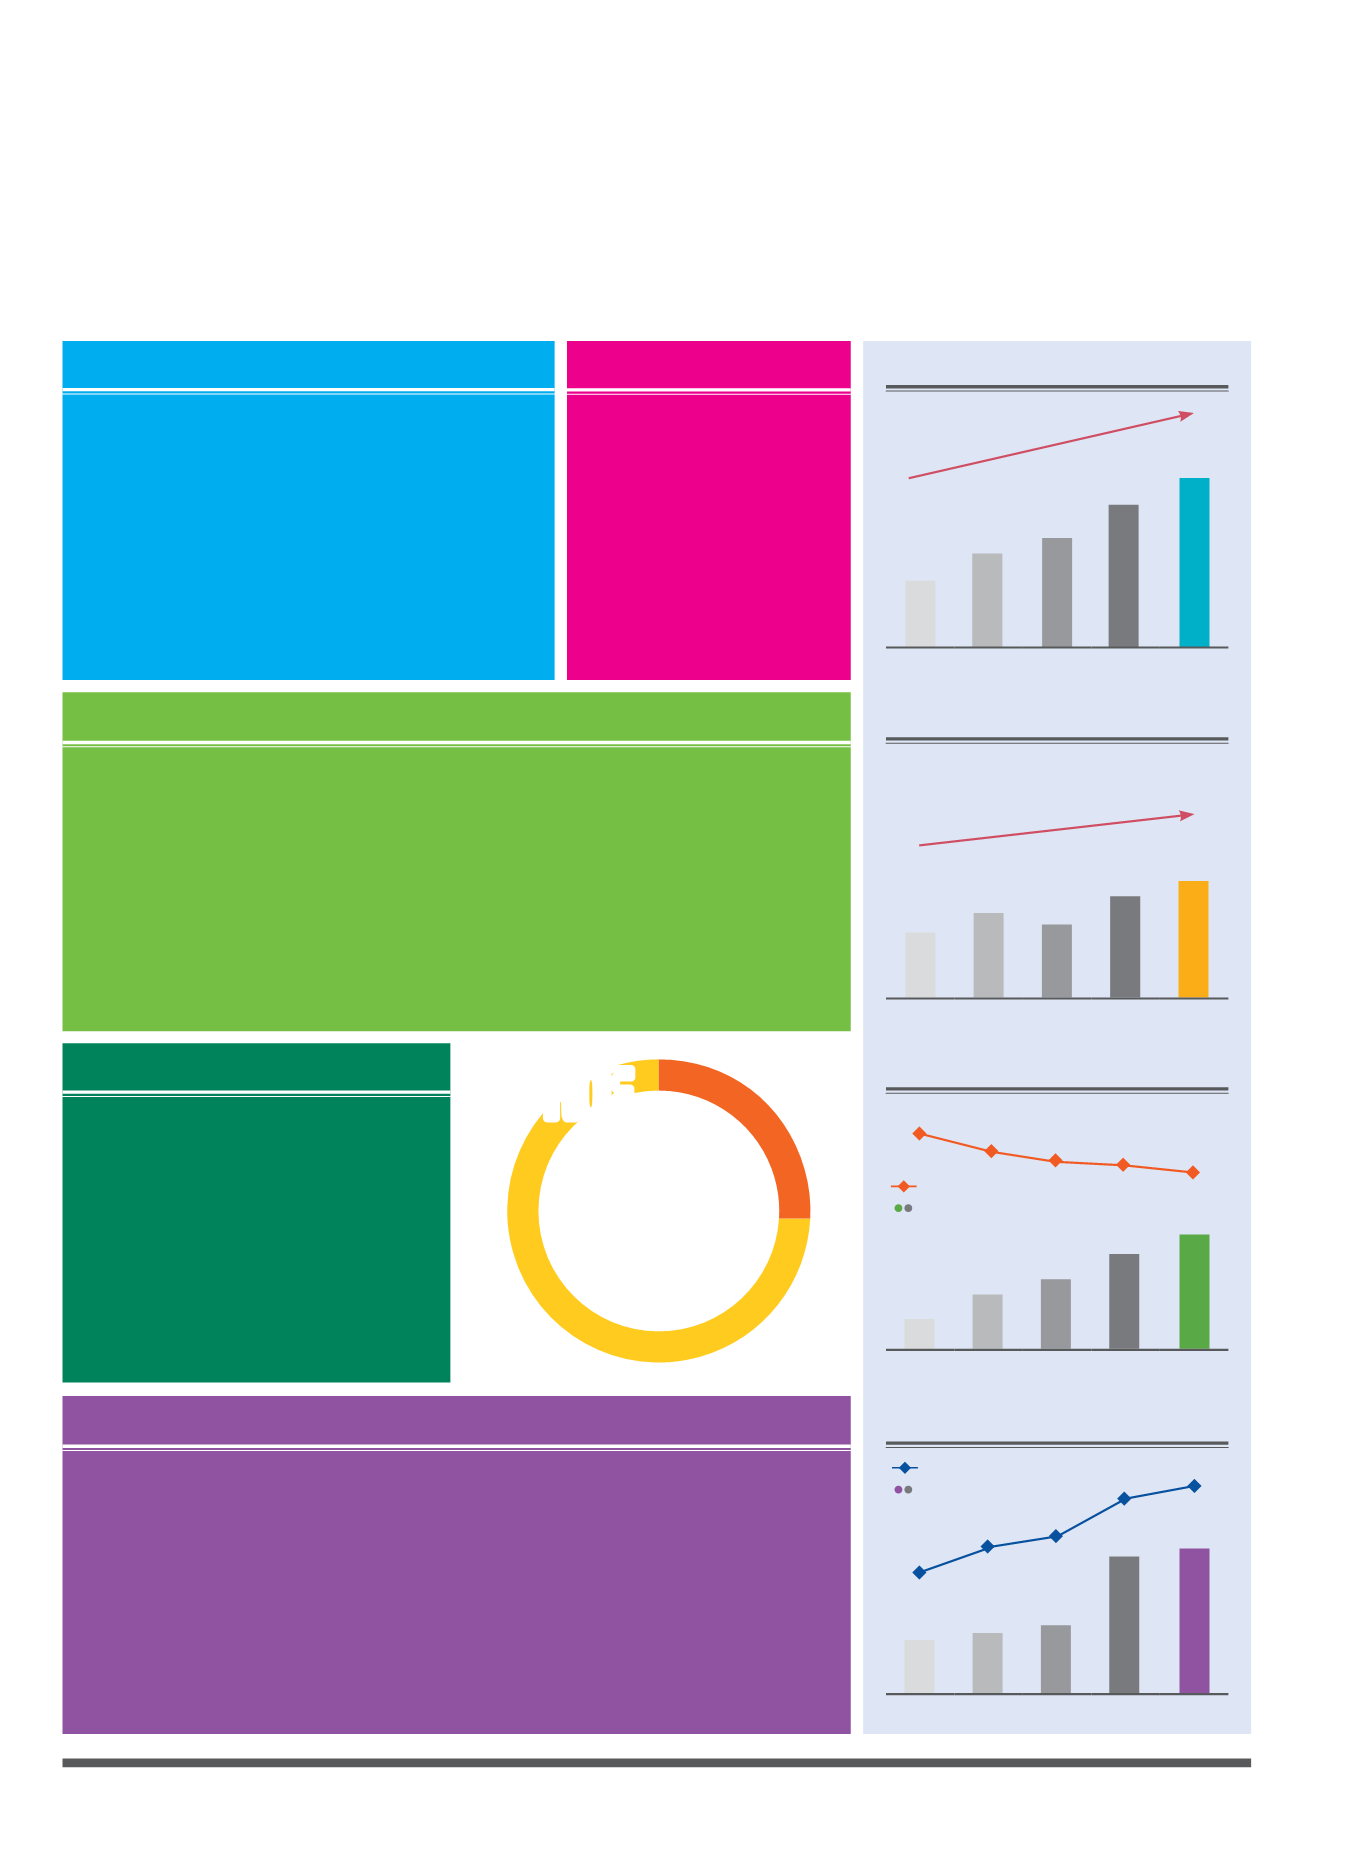
Operating Revenue (RM million)
331.3
*CAGR: 9%
381.5
388.5
439.8
471.3
2010 2011 2012 2013 2014
Operating Expenses (RM million)
196.6
212.0
209.2
229.4
232.0
*CAGR: 4%
2010 2011 2012 2013 2014
PATAMI and Cost to Income Ratio
111.9
54.7
51.1 49.3 48.3 46.1
143.1
150.6
173.1
198.2
PATAMI (RM million)
Net Dividend (Sen)
Cost to Income Ratio (%)
Dividend Yield (%)
2010 2011 2012 2013 2014
Net Dividend and Dividend Yield
20.0
26.0
27.0
52.0
54.0
2.6
3.9
4.3
6.3
6.7
2010 2011 2012 2013 2014


