


 9 / 206

Bursa Malaysia
•
Annual Report 2014
7
18.0
16.0
20.0
20.0
THE YEAR IN BRIEF
SHAREHOLDER VALUE CREATION
SHAREHOLDER RETURN
Bursa Malaysia has a proven track record of delivering annual dividend payout of more than 90% over the years. We had also declared special dividends consecutively
in 2013 and 2014.
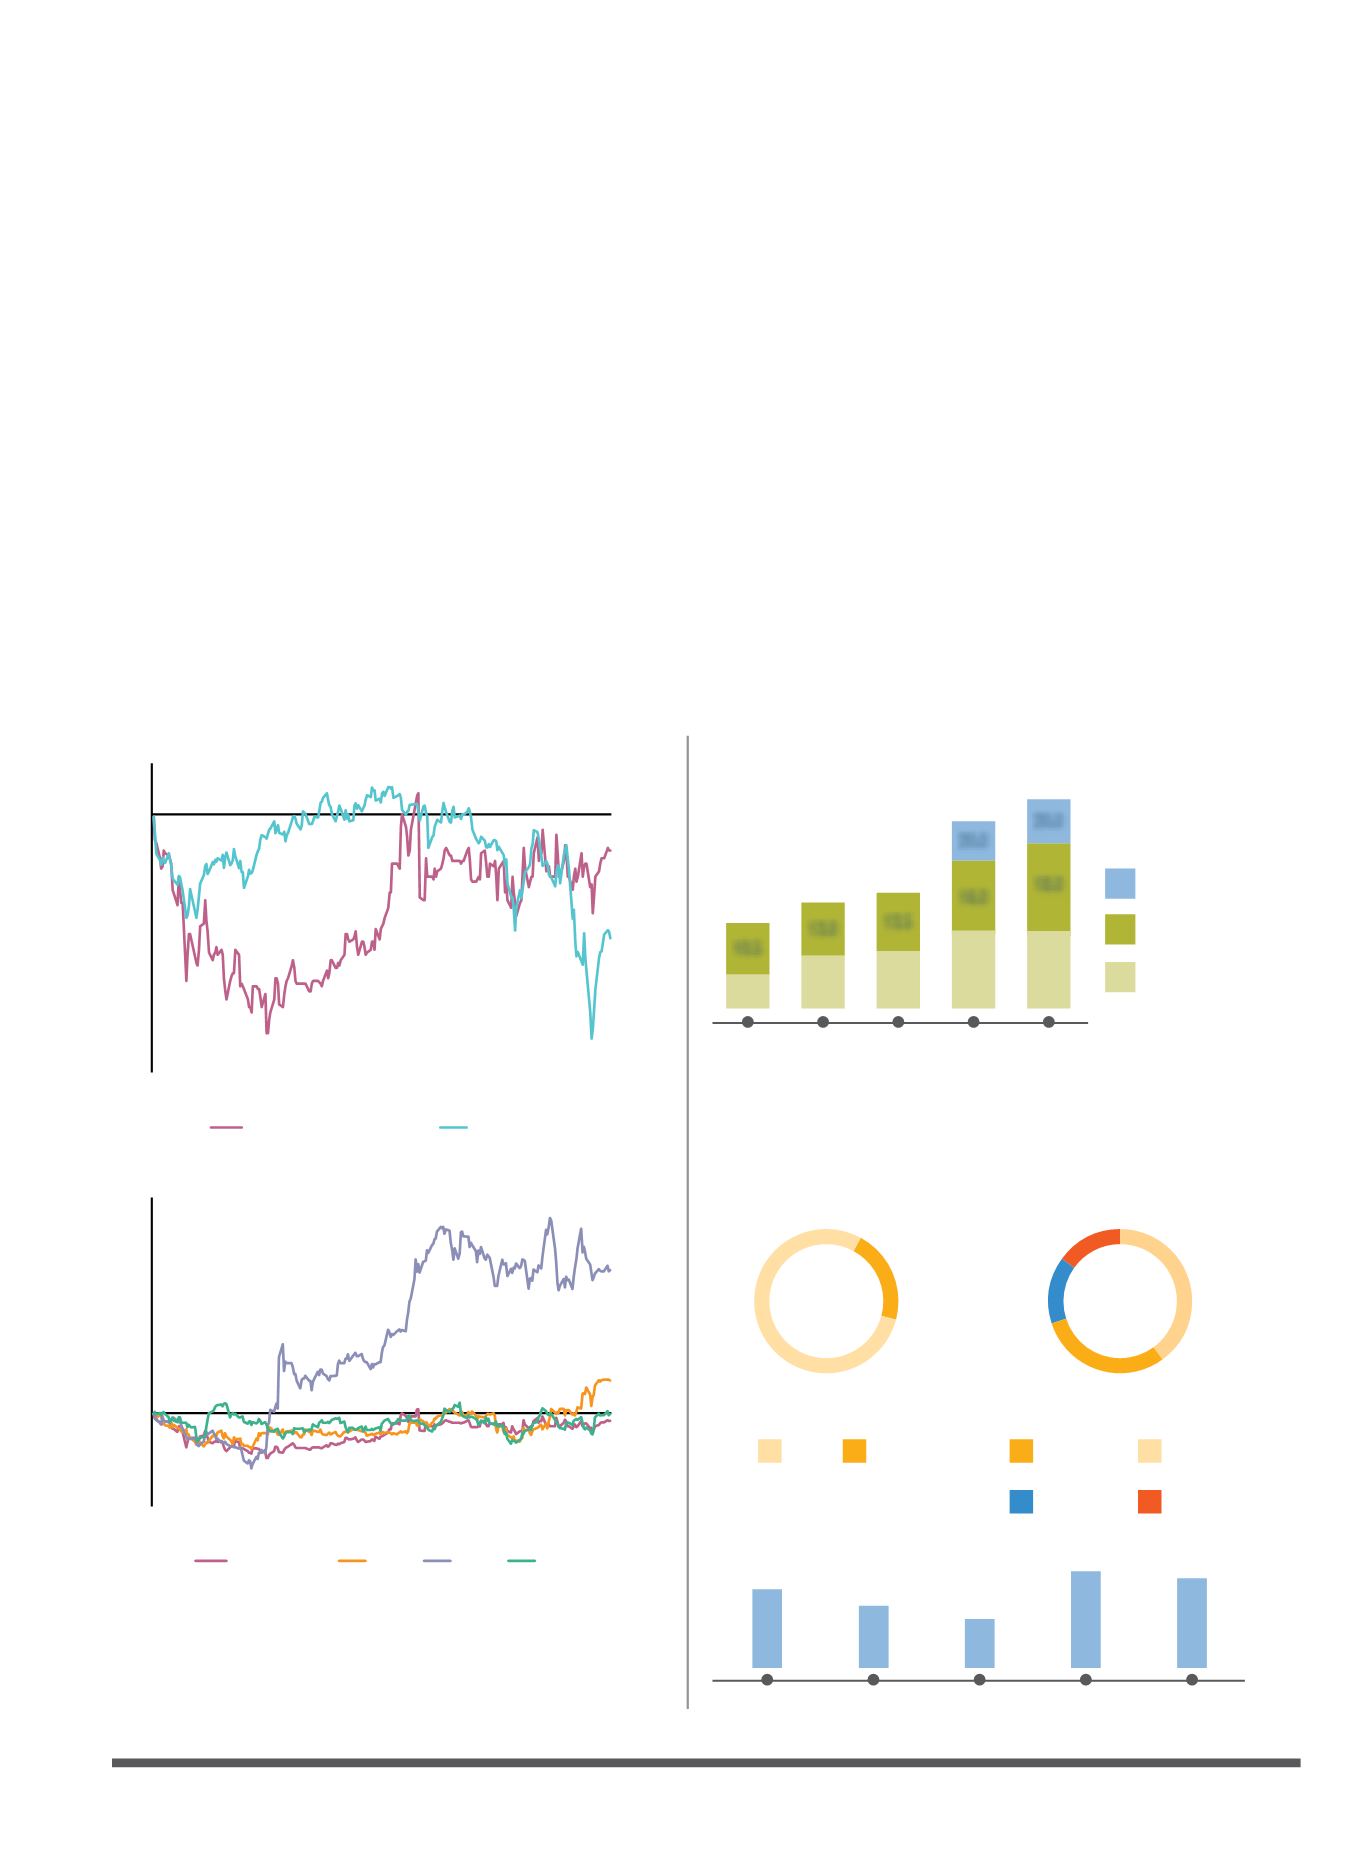
SHARE PRICE PERFORMANCE
Bursa Malaysia recorded a strong financial performance in 2014, with key metrics such as PATAMI increasing by 15% year-on-year and ROE rising to reach 25%.
Meanwhile, the share price of the Exchange recorded a marginal decline of 2%, a reflection of weaker sentiment across the broader market.
Starting the year strong at RM8.23 after a 32% gain made in 2013, Bursa Malaysia’s share price began shedding value in the 1
st
half of 2014, reaching a low of
RM7.40 on 1 April before recovering. In the wider market, the FBM KLCI proved more resilient in the face of adverse news flows which included concerns over
economic slowdowns in China and the Eurozone and rising geo-political tensions over the Ukraine.
Moving into the 2
nd
half of 2014, the announcement of a special dividend of 20 sen for Bursa Malaysia’s shareholders and strong market trading values in the 3
rd
quarter
managed to sustain the Exchange’s share price over the remainder of the year, while the FBM KLCI eventually succumbed to pressure over the sharp fall in global oil prices
and the weakening Ringgit Malaysia over the final months of the year. This resulted in Bursa Malaysia outperforming the benchmark index over the year.
Market Capitalisation (RM billion)
2010
2011
2012
2013
2014
4.1
4.4
4.3
3.6
3.3
Local
Government
Agencies
Foreign
Nominees
Individuals
Institutions
23%
77%
15%
15%
30%
40%
Shareholding structure
as at 31 December 2014
Foreign Shareholding
as at 31 December 2014
Investor Relations Contact
All investors are welcome to contact the Investor Relations (IR) team directly
at
ir@bursamalaysia.comor visit the IR section on our website, where you
can subscribe to regular updates on Bursa Malaysia via email alerts.
Bursa Malaysia Share Price Performance vs. FBM KLCI
FBM KLCI
Bursa Malaysia Share Price
Jan
Feb
Mar
Apr
May
Jun
Jul
Aug
Sep
Oct
Nov
Dec
2
0
-2
-4
-6
-8
-10
-12
-2%
-6%
Bursa Malaysia Share Price Performance vs. Listed Asian Peers
SGX
HKEx
ASX
Bursa Malaysia
Jan
Feb
Mar
Apr
May
Jun
Jul
Aug
Sep
Oct
Nov
Dec
50
40
30
20
10
0
-10
-20
33%
0%
-2%
8%
Highest Annual Dividend Payout in 2014
2010 2011 2012 2013 2014
94%
Payout
95%
Payout
95%
Payout
98% *
Payout
92% *
Payout
* Payout as a percentage of PATAMI
does not include special dividend
Final Dividend (sen)
Interim Dividend (sen)
10.5
9.5
13.0
13.0 13.5
13.5 16.0 16.0
Special Dividend (sen)
Shareholding Structure and Market Capitalisation
Our public shareholding of 65% provides a fair free float for Bursa Malaysia’s
shares and a good level of liquidity. As at the end of 2014, we had a total
shareholder count of 19,435. Our market capitalisation, meanwhile, decreased
slightly from RM4.4 billion in 2013 to RM4.3 billion in 2014.