


 8 / 222

THE YEAR IN BRIEF
6
Bursa Malaysia •
Annual Report 2015
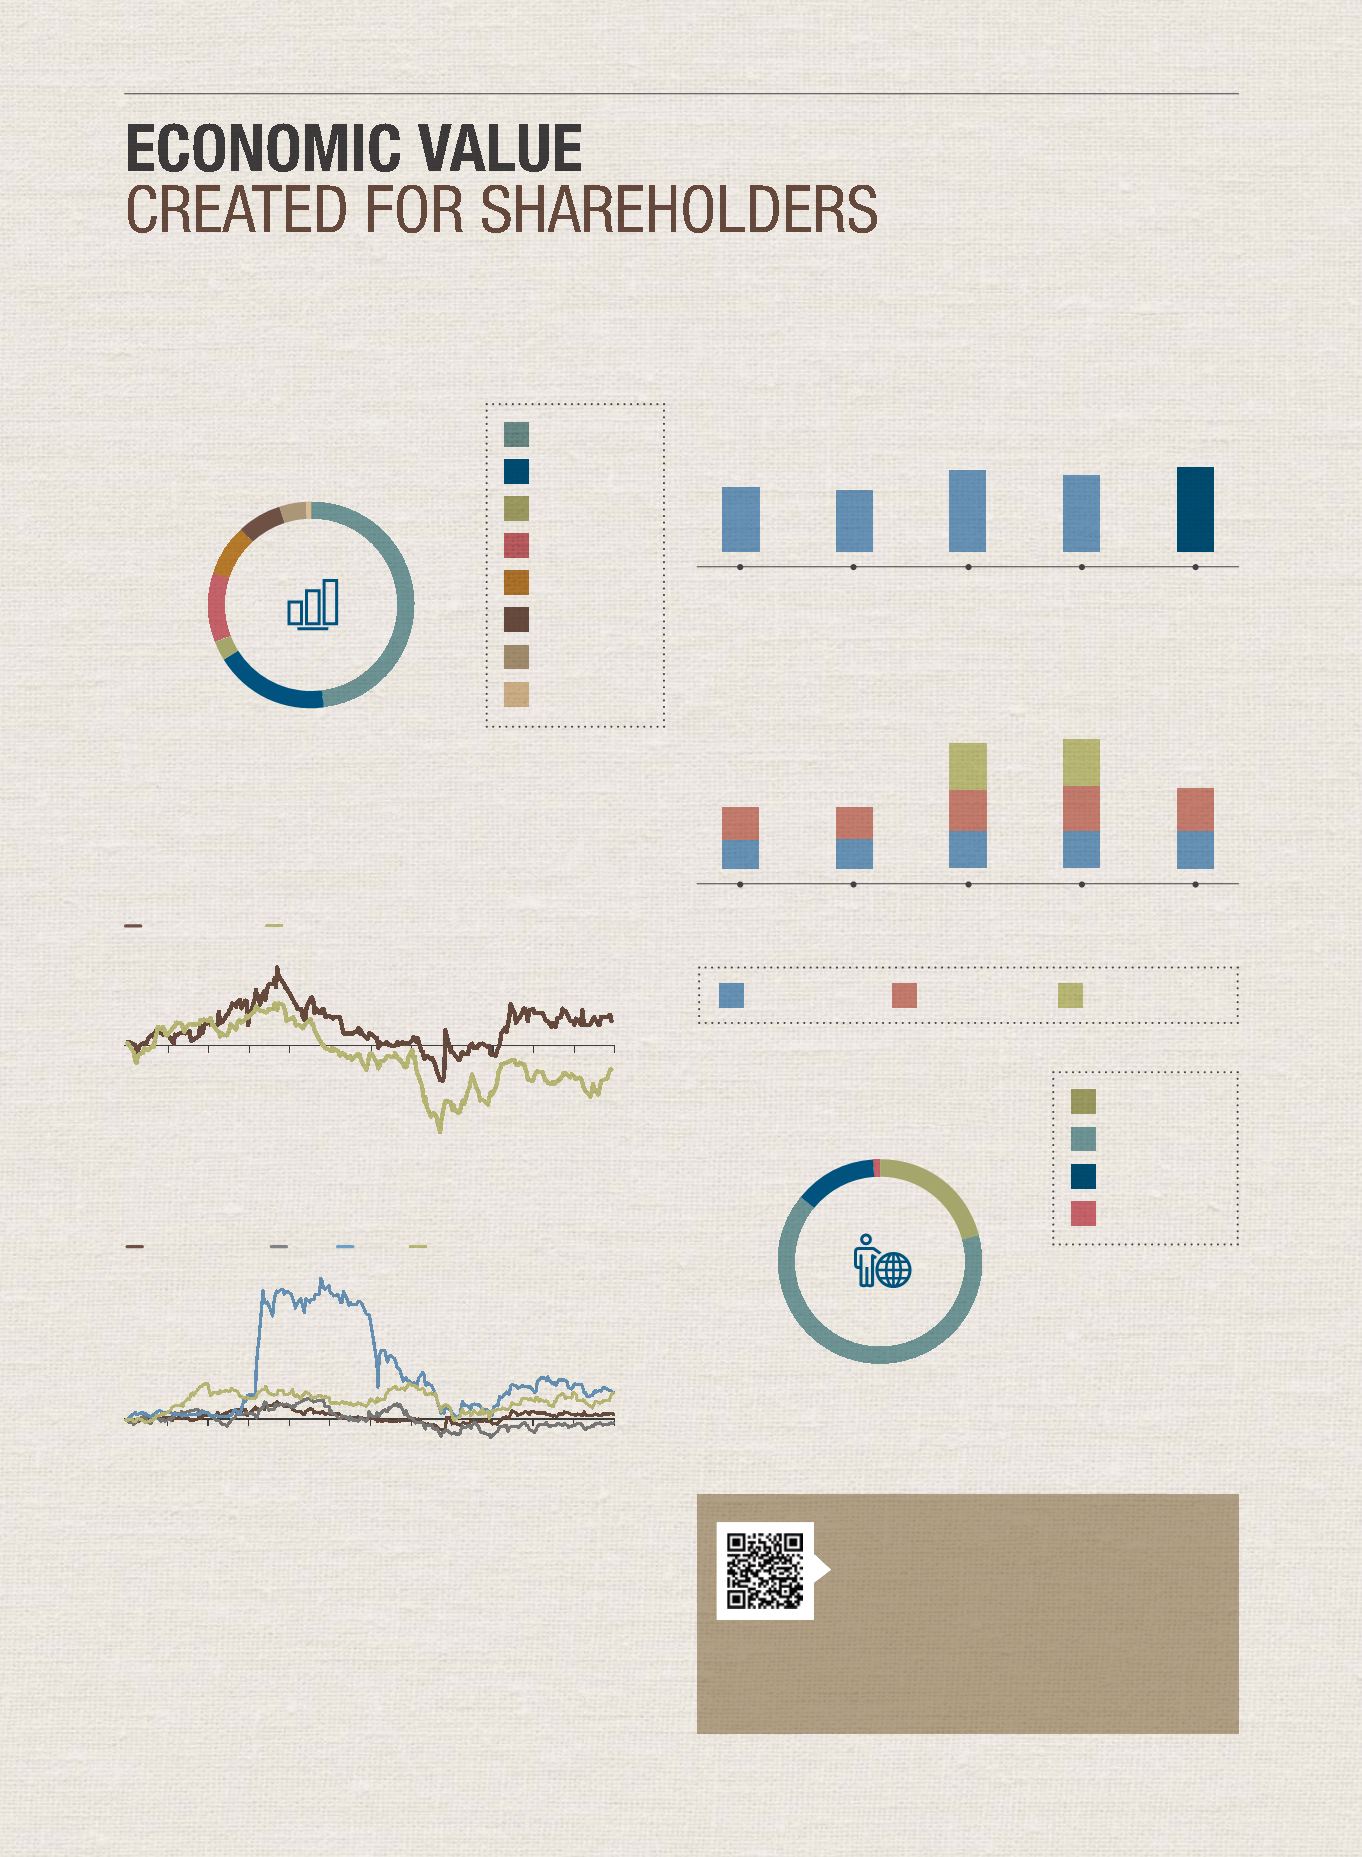
OPERATING REVENUE
(RM million)
1% 4%
7%
8%
11%
3%
18%
48%
5.9
20.8
33.7
38.4
52.9
16.8
86.1
233.1
Depository Services
Market Data
Member Services &
Connectivity
Listing & Issuer
Services
Others
Securities Trading
Derivatives Trading
BSAS Trading
Total operating revenue for 2015 rose 3% to RM487.7 million from
RM471.3 million in 2014.
MARKET CAPITALISATION*
(RM billion)
2011
2012
2013
2014
2015
2011
2012
2013
2014
2015
3.6
3.3
4.4
4.3
4.5
INVESTOR RELATIONS CONTACT
Shareholders and investors may contact the
Investor Relations (“IR”) team directly at
ir@bursamalaysia.comor via the IR section on
our website. You can also subscribe to our alert
list to receive regular Bursa Malaysia updates via
email from our website.
FIVE-YEAR DIVIDEND PAYOUT TO SHAREHOLDERS
* The dividend payout as a percentage of PATAMI, not including special dividend
Interim Dividend (sen)
Final Dividend (sen)
Special Dividend (sen)
SHAREHOLDER MIX
Domestic vs. Foreign Shareholders
Our public shareholding of 61% represents a fair free float of Bursa
Malaysia’s shares and a healthy level of liquidity. As at the end of 2015, we
had a total of 17,702 shareholders.
Domestic Retail
Domestic Institution
Foreign Retail
Foreign Institution
21%
13%
65%
1%
SHARE PRICE PERFORMANCE
Bursa Malaysia Share Price Performance vs. FBM KLCI
BURSA MALAYSIA
FBM KLCI
3%
-4%
Mar
Jan
Jun
Sep
Dec
Bursa Malaysia’s share price increased 3% reflecting its resilience
within volatile market conditions. Starting the year strong at RM8.10,
Bursa Malaysia’s share price traded at its highest level since 2011
at RM9.00 on 24
th
April 2015. The share price closed at RM8.35 on
31
st
December 2015.
In the wider market, the FBM KLCI was weighed down by several factors,
including a weaker Ringgit, depressed commodity prices, a slowdown in China’s
economy and higher interest rates in the US resulting in capital outflows.
Mar
Jan
Jun
Sep
Dec
Bursa Malaysia Share Price Performance vs. Listed Asian Peers
BURSA MALAYSIA
SGX
ASX
HKEx
16%
16%
3%
-1%
* As at 31
st
December
95%
95%
98%*
92%*
93%
13.0
13.0
16.0
16.0
20.0
16.5
18.0
18.0
16.0
20.0
13.5
13.5