


 15 / 222

THE YEAR IN BRIEF
13
Bursa Malaysia •
Annual Report 2015
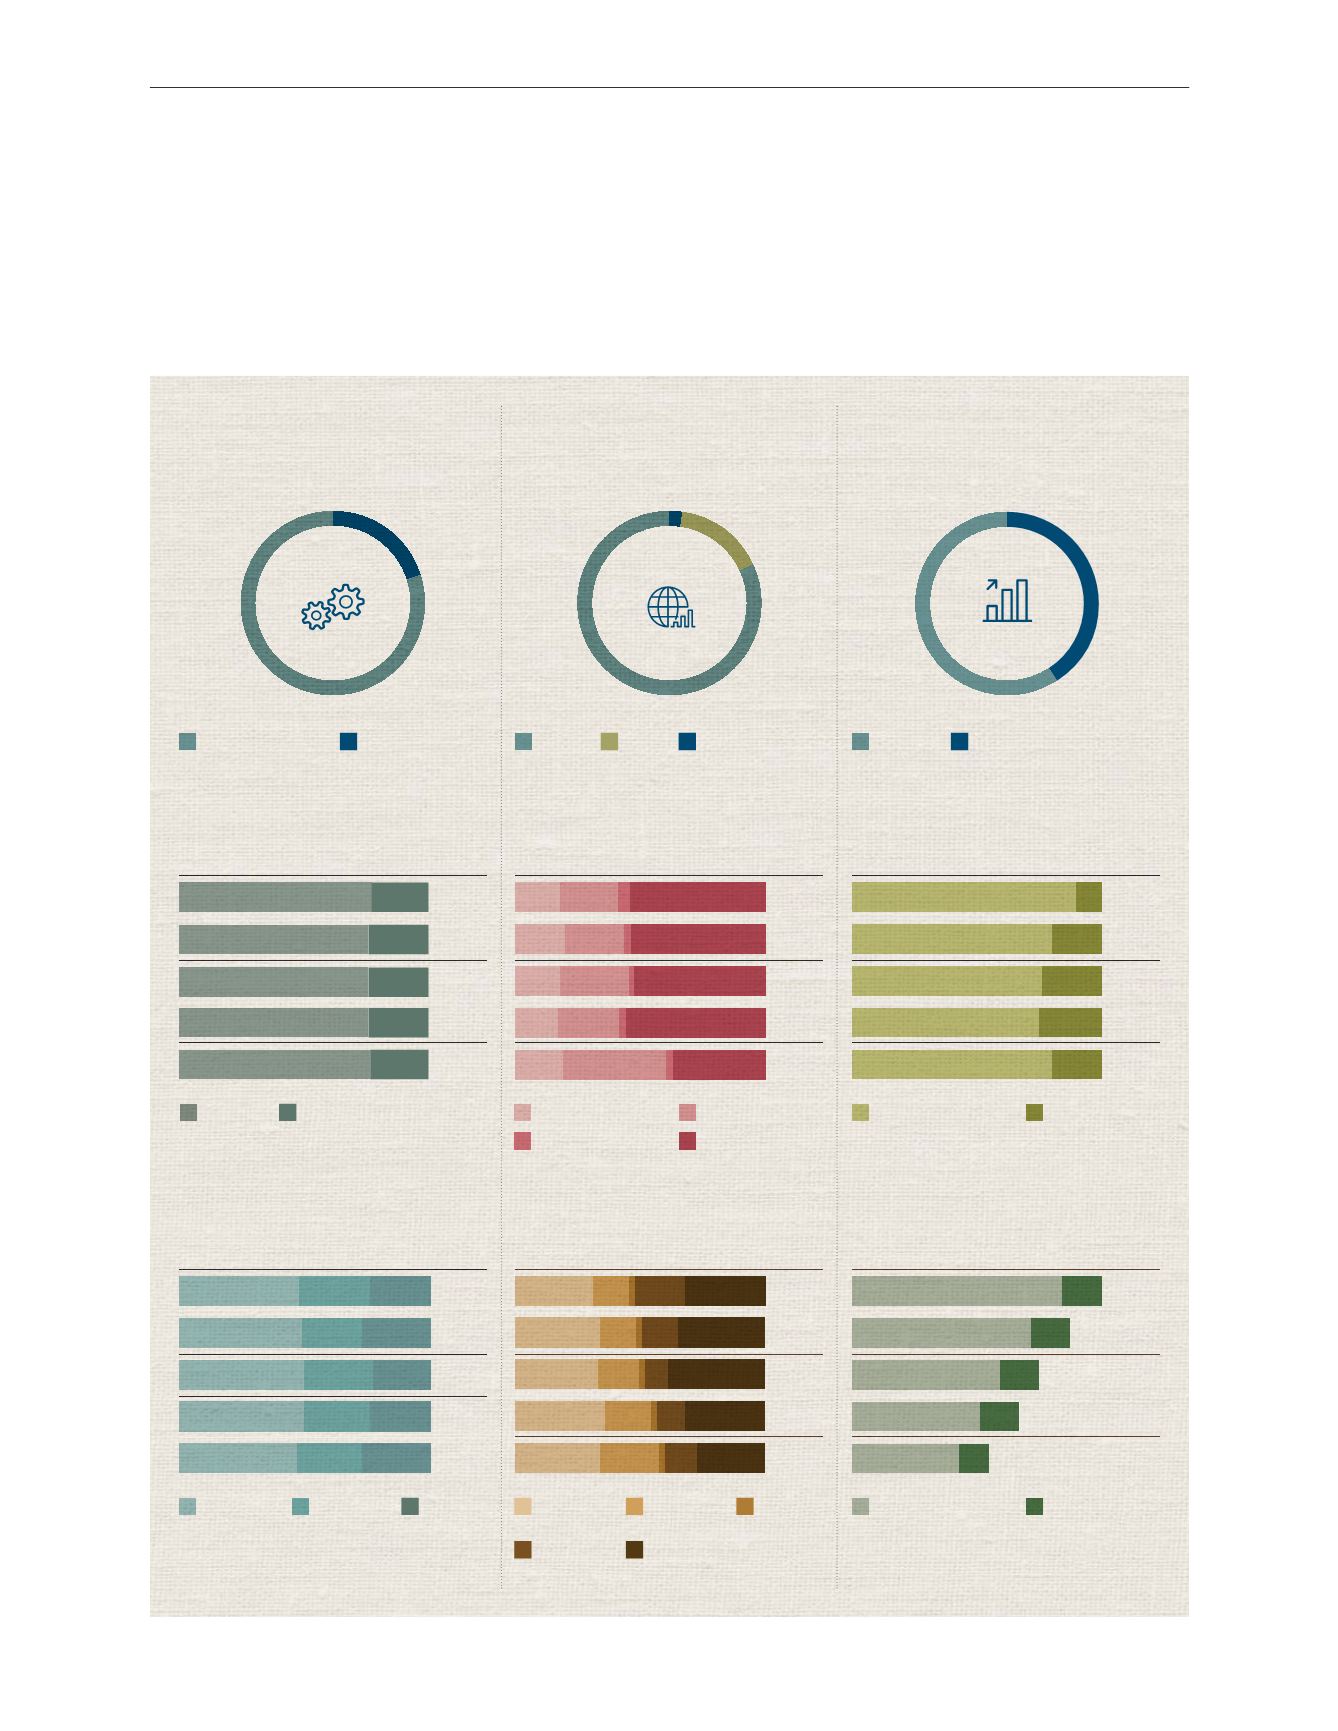
MARKET
HIGHLIGHTS
SECURITIES MARKET
DERIVATIVES MARKET
ISLAMIC CAPITAL MARKET
2%
16%
82%
19%
81%
Demography of BSAS Registered Participants
No. of Trading Participants
109
(2015)
2012
51
18
20
14
73
20
2013
60
18
2011
42
13
20
15
22
87
Market Demography by Trading Value (%)
Total Trading Value
- OMT
RM512 billion
(2015)
20
11
26
25
49
20
12
23
25
52
20
13
22
26
52
20
14
26
23
51
20
15
23
27
50
41%
59%
Market Demography of BSAS Trading Value (%)
Total Commodity
Trading Value
RM3,728 billion
(2015)
20
11
21
79
20
12
32
68
20
13
70
30
20
14
21
79
2015
12
88
11.0 million
(2015)
Market Demography of FCPO Contracts (%)
No. of Contracts Traded
Market Demography of FKLI Contracts (%)
No. of Contracts Traded
3.0 million
(2015)
RM1,695 billion
(31 Dec 2015)
Share Ownership (%)
Market Capitalisation
Funds Raised from New IPOs &
Secondary Market in 2015
Open Interest as at 31 Dec 2015
Value of Listed Sukuk as at 31 Dec 2015
Secondary Market
Foreign
New IPOs
Domestic
FKLI
Others
FCPO
20
14
2
54
24
20
2013
1
53
28
18
20
12
2
56
25
17
20
11
2 37
42
19
20
15
5
55
22
18
20
11
28
131 24
34
20
12
1
32
12
19
36
20
13
1
39
10
33
17
20
14
1
35
15
34
15
2015
32
21
31
15 1
2011
23
77
2012
24
76
2015
78
22
2013
24
76
2014
24
76
Domestic Institution
Local
Foreign Institution
Domestic Retail
Foreign
Retail
Local
Domestic
Institution
Foreign
Institution
Domestic
Retail
Domestic Institution
Foreign Institution
Domestic Institution
Foreign Institution
Domestic
Institution
Foreign
Institution
Retail
Foreign
Domestic