


 35 / 222

FROM THE BOARD OF DIRECTORS AND SENIOR MANAGEMENT
31
Bursa Malaysia •
Annual Report 2015
CEO’S MESSAGE
AND MANAGEMENT
DISCUSSION AND ANALYSIS
RM198.6
PATAMI improved to
RM206.4
PAT grew to
million
million
While sustainability is gradually taking root in our PLCs, we believe that
we must take the sustainability agenda to the next level to secure long-
term viability of our PLCs and our marketplace.
In 2015, we took a four-pronged approach to sustainability:
• Communicating our sustainability vision and goals through our
flagship events, i.e. the ASEAN CAP10 Sustainability Series and
Sustainability Symposium
• Introducing a new Sustainability Reporting Guide and six toolkits for
PLCs to encourage sustainable practices in their operations.
• Committing ourselves to the best sustainability practices by signing
on to the United Nation’s Sustainable Stock Exchange (“UN SSE”)
initiative
• Transforming the way our PLCs operate and report on sustainability
via the FTSE4Good Bursa Malaysia Index and through Environment,
Social and Governance (“ESG”) engagement programmes
We recognise that sustainability is an ongoing conversation rather than
an achievement, and hence we will continue to enhance our sustainability
practices going forward. We are also proud to report that we are the first
exchange in the region to develop a sustainability framework, and we aim
to maintain this competitive advantage.
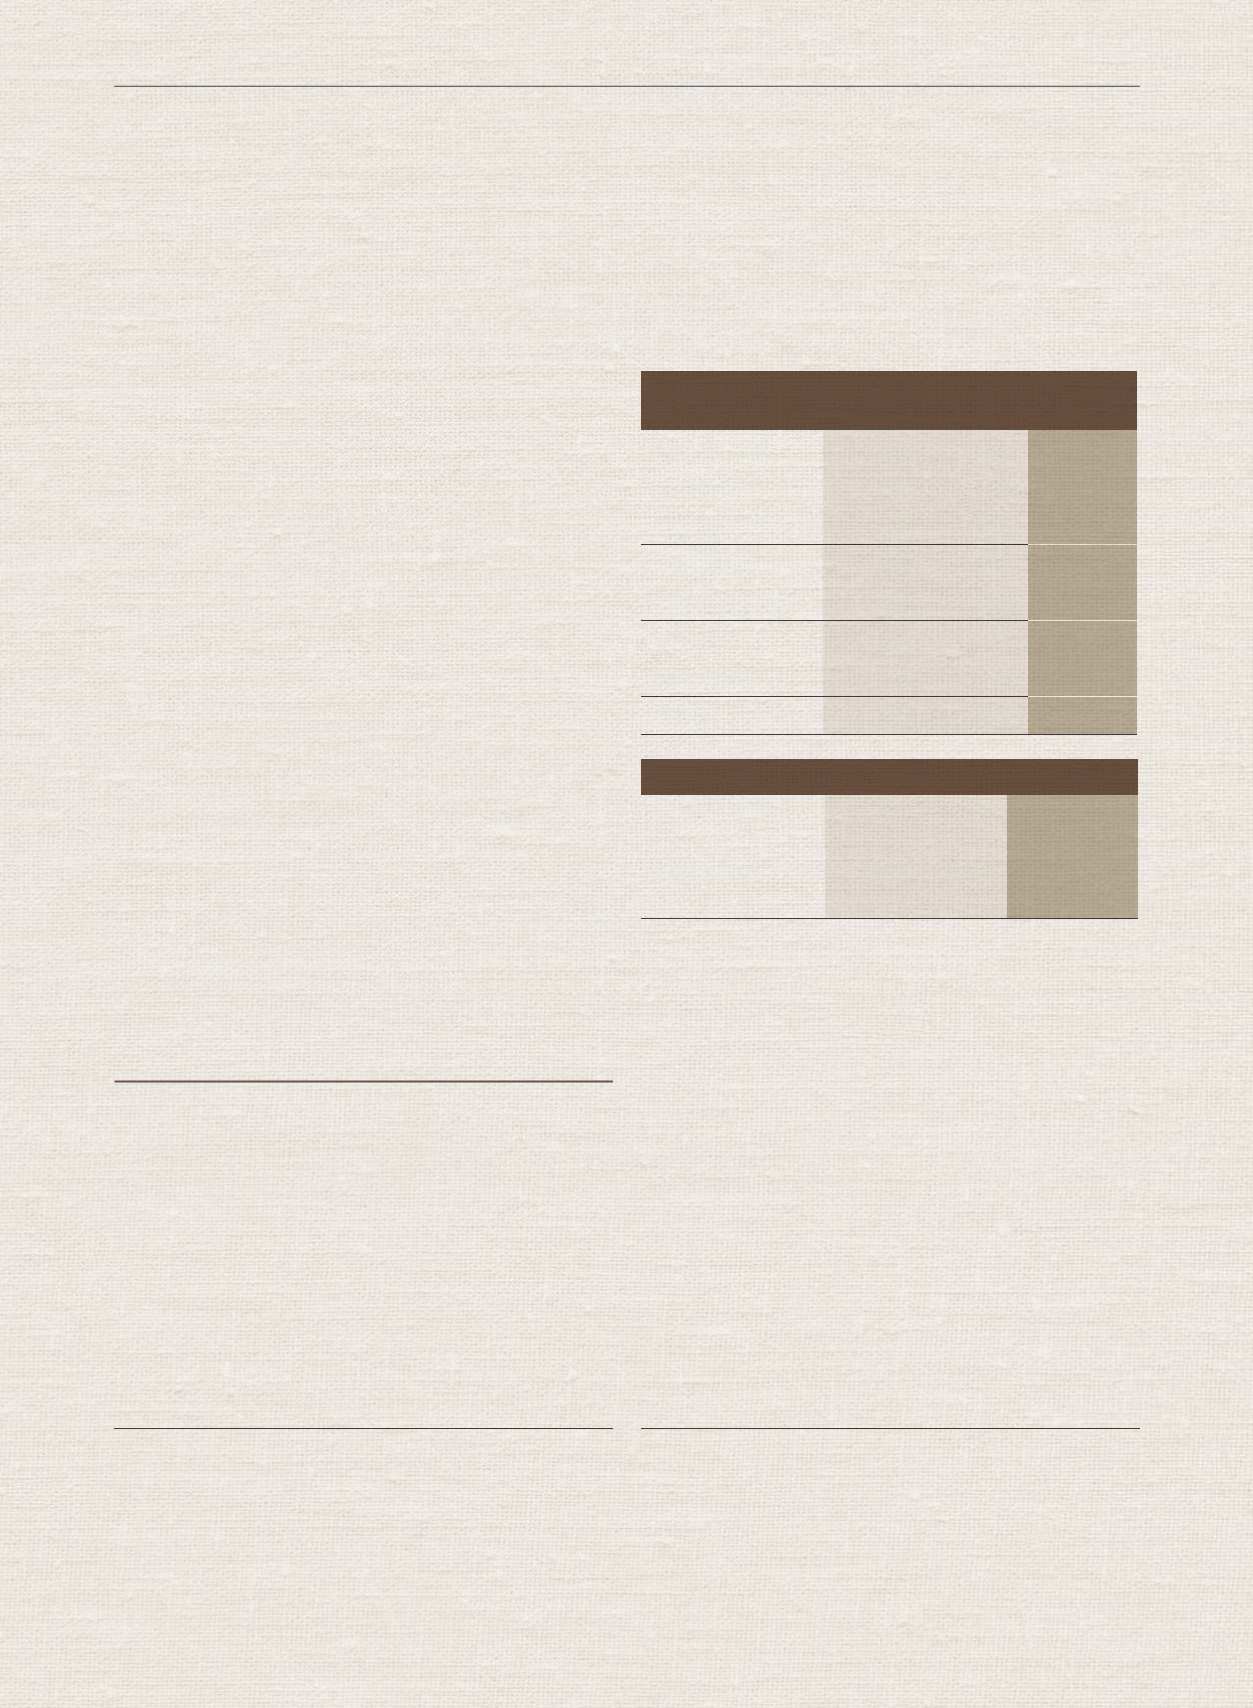
SUSTAINED FINANCIAL PERFORMANCE
AMIDST CHALLENGING CONDITIONS
The Exchange improved its financial performance from 2014 with profit
after tax and minority interest (“PATAMI”) of RM198.6 million from
RM198.2 million a year ago. The cost to income ratio was sustained at
46.2% while Return on Equity (“ROE”) improved slightly to 25.6%.
Fi
na
nc
ia
l
Re
su
lt
s
20
15
RM
m
il
li
on
2014
RM
mil
li
on
%
ch
an
ge
Operating
Re
venue
48
7.
7
47
1.
3
+3
%
Other Inco
me
30
.8
32.5
-5
%
Op
er
atin
g
Ex
penses
(239.8
)
(232.0
)
+3
%
Pr
ofit
Before Tax
278.7
27
1.
8
+3
%
Inco
me
T
ax
E
xpen
se
(7
2.
3)
(67.8)
+7
%
Profit
Af
ter Tax
206.
4
20
4.
0
+1%
Mi
no
ri
ty I
nt
er
est
(7.8)
(5.8)
+3
5%
PATAMI
19
8.6
198.2
+0
.2%
Fi
nanc
ia
l
Ra
ti
os
20
15
2014
c
ha
ng
e
Cost
t
o In
come R
at
io
46
.2
%
46.1%
+0
.1
p
er
ce
nt
ag
e
po
in
t
Return
o
n Eq
ui
ty
25
.6
% 25.4%
+0
.2
p
er
ce
nt
ag
e
po
in
t
OPERATING REVENUE GROWTH DRIVEN BY NON-SECURITIES
TRADING REVENUE
Operating revenue rose 3% to RM487.7 million in 2015 from RM471.3
million in 2014. This was due mainly to a significant rise in non-securities
trading revenue as securities trading revenue fell 3% in 2015 to RM233.0
million. Meanwhile, revenue contributions from the Derivatives Market
and the Islamic Capital Market (“ICM”) rose 22% to RM86.1 million and
69% to RM16.8 million respectively.