
FROM THE BOARD OF DIRECTORS AND SENIOR MANAGEMENT
33
Bursa Malaysia •
Annual Report 2015
CEO’S MESSAGE
AND MANAGEMENT
DISCUSSION AND ANALYSIS
SECURITIES MARKET
SECURITIES MARKET SEGMENTAL REVENUE
2015
RM m
il
li
on
20
14
RM
m
illi
on
%
ch
ange
Tr
ad
ing Re
ve
nu
e
23
3.
1
239.
1
-3
%
Listin
g
an
d
Issu
er
Se
rvic
es
52.7
55.8
-6
%
De
po
si
tory
S
ervi
ces
38
4
.
35.4
+9
%
Ma
rk
et
D
ata
25
.7
24.0
+7%
Member S
er
vi
ce
s
an
d
Connec
tivi
ty
12
.9
13.6
-5
%
Co
nfer
ence
I
nc
om
e
-
0.2
-1
00
%
Total
362.8
368.1
-1
%
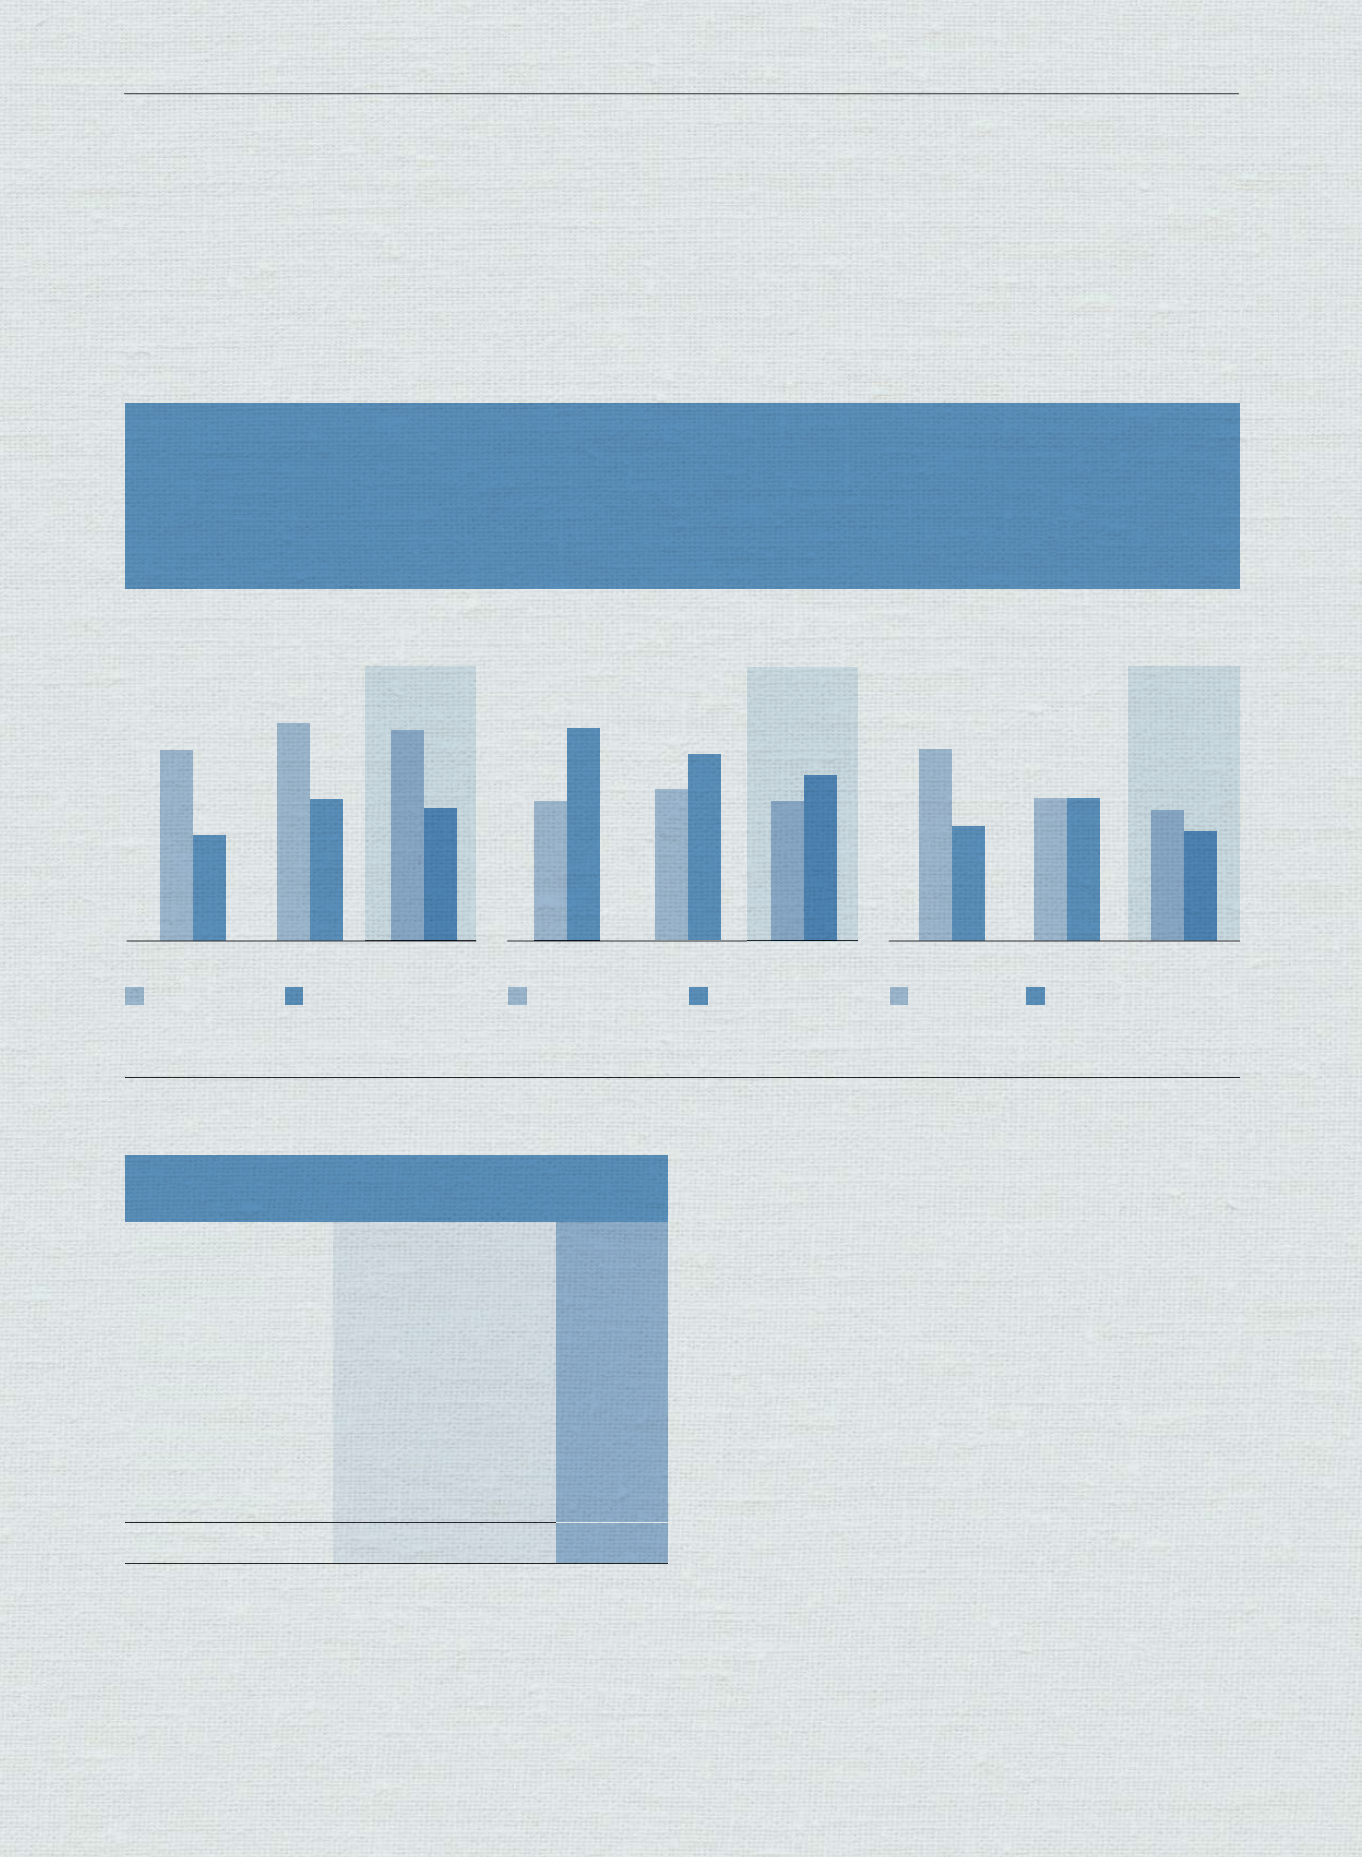
MARKET VOLATILITY DAMPENS TRADING SENTIMENTS
Profit contributions from the Securities Market fell 3% in 2015 to RM285.7
million from RM294.3 million in 2014 as volatile market conditions
impacted trading activities. Total operating revenue fell 1% to RM362.8
million from RM368.1 million a year ago.
Trading revenue fell 3% to RM233.1 million owing to lower average daily
value (“ADV”) for on-market trades (“OMT”) and direct business trades
(“DBT”) of RM2.1 billion (-4% from RM2.2 billion y-o-y). For OMT, foreign
participation rose to account for 27% of total ADV (RM0.5 billion) from 24%
a year ago. Revenue from Bursa Malaysia’s Listing and Issuer Services
also fell 6% to RM52.7 million from RM55.8 million in 2014 due to fewer
large Initial Public Offerings (“IPOs”) and corporate exercises conducted
in 2015.
On a positive note, contributions from our Depository Services and Market
Data rose 9% and 7% to RM38.4 million and RM25.7 million respectively.
The contributions from these sources are attributable to higher earnings
from CDS custody fees and a higher number of market data subscribers
respectively.
The FBM KLCI traded within a lower band in 2015 and hit a multi-year low of
1,503.68 points in August 2015. However, the index recovered and closed the
year at 1,692.51 points.
SEGMENT PROFIT AND OPERATING MARGIN
294.3
77.3
256.8
73.6
285.7
76.1
ADV - OMT & DBT AND FBM KLCI
2.1
1,692.51
2.1
1,866.96
2.2
1,761.25
NO. OF NEW LISTINGS AND FUNDS RAISED
14 24.3
18
22.5
11
21.2
Segment Profit
(RM million)
Operating Margin (%)
ADV - OMT & DBT
(RM billion)
FBM KLCI
No. of New
Listings
Funds Raised from
IPOs & Secondary
Market (RM billion)
2013
2013
2013
2014
2014
2014
2015
2015
2015


