


 40 / 222

FROM THE BOARD OF DIRECTORS AND SENIOR MANAGEMENT
36
Bursa Malaysia •
Annual Report 2015
CEO’S MESSAGE
AND MANAGEMENT
DISCUSSION AND ANALYSIS
DERIVATIVES MARKET
Trading volumes for all contracts set a new record in 2015 with ADC rising 13% to
57,157 contracts from 50,654 contracts in 2014. The greater trading activity was
driven by fluctuations in the prices of underlying commodities and the FBM KLCI.
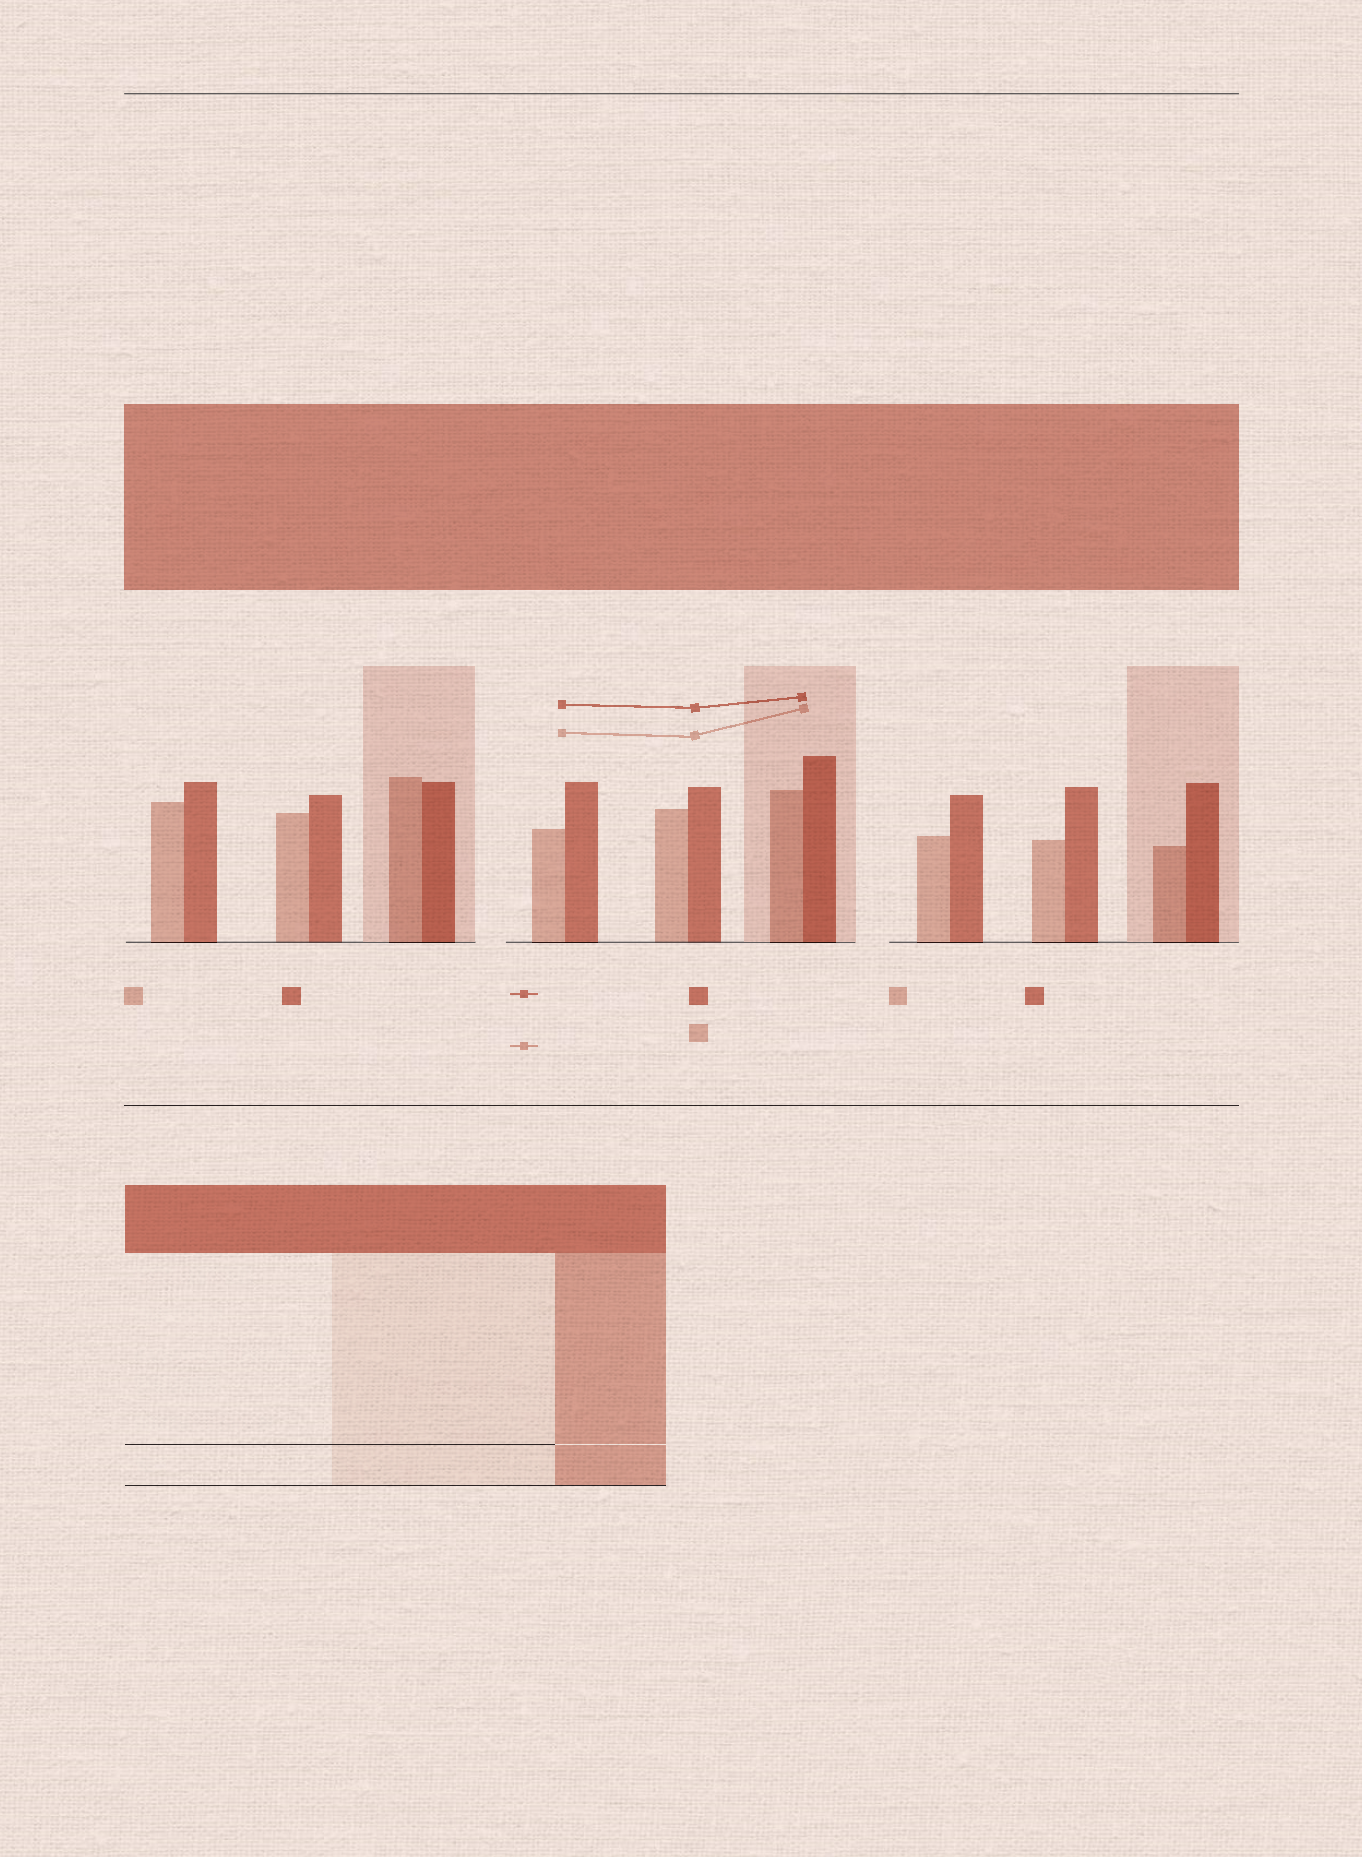
SEGMENT PROFIT AND OPERATING MARGIN
FOREIGN AND DOMESTIC PARTICIPATION
40.8
45.7
44.1
50.3
51.2 50.1
43.5
196.5
38
62
42
58
39
61
20
15
RM
m
il
li
on
20
14
RM
m
il
lion
%
ch
an
ge
Trad
ing Revenue
86
.1
70.6
+22%
Market Data
7.
8
7.
1
+1
0%
Me
mber S
er
vi
ce
s
an
d
Co
nn
ectivity
0.
3
1.
9
-8
6%
Co
nf
er
ence
I
nc
om
e
5.
8
6.
2
-5
%
Total
10
0.
0
85
.8
+17%
DERIVATIVES MARKET SEGMENTAL REVENUE
DERIVATIVES TRADING BOLSTERED BY VOLATILE COMMODITY PRICES
The Derivatives Market’s segmental profit grew by 25% to RM51.2 million
from RM40.8 million in 2014, while operating revenue rose 17% to RM100.0
million from RM85.8 million a year ago.
The growth was attributed to higher trading revenue, which saw the volume
of FCPO and FKLI contracts traded grow by 8% to 11.0 million contracts
from 10.2 million contracts, and by 39% to 3.0 million contracts from 2.2
million contracts respectively. Other positive contributors to operating
revenue included higher guarantee and collateral management fees due to
higher margin requirement for FCPO and FKLI, as well as the higher number
of open interest positions.
Conversely, revenue from member services and connectivity fell 86% due
to the cessation of the Derivatives OMS service following the system’s
retirement in December 2014. Since end February 2015, brokers have
migrated to their individual authorised OMS.
50.7
196.4
57.2
230.4
17%
9%
15%
21%
16%
7%
Segment Profit
(RM million)
Operating Margin (%)
ADC (’000)
Open Interest (’000)
Foreign (%)
Domestic (%)
Volatility of Crude
Palm Oil Prices
Volatility of
FBM KLCI
ADC OPEN INTEREST AND VOLATILITY
2013
2013
2013
2014
2014
2014
2015
2015
2015