2013
2012
Bursa Malaysia • Annual Report 2013
30
FINANCIAL
HIGHLIGHTS
52 sen
93%
RM173.1
MILLION
15%
48%
Dividend
PATAMI
COST TO
INCOME
RATIO
ROE
21%
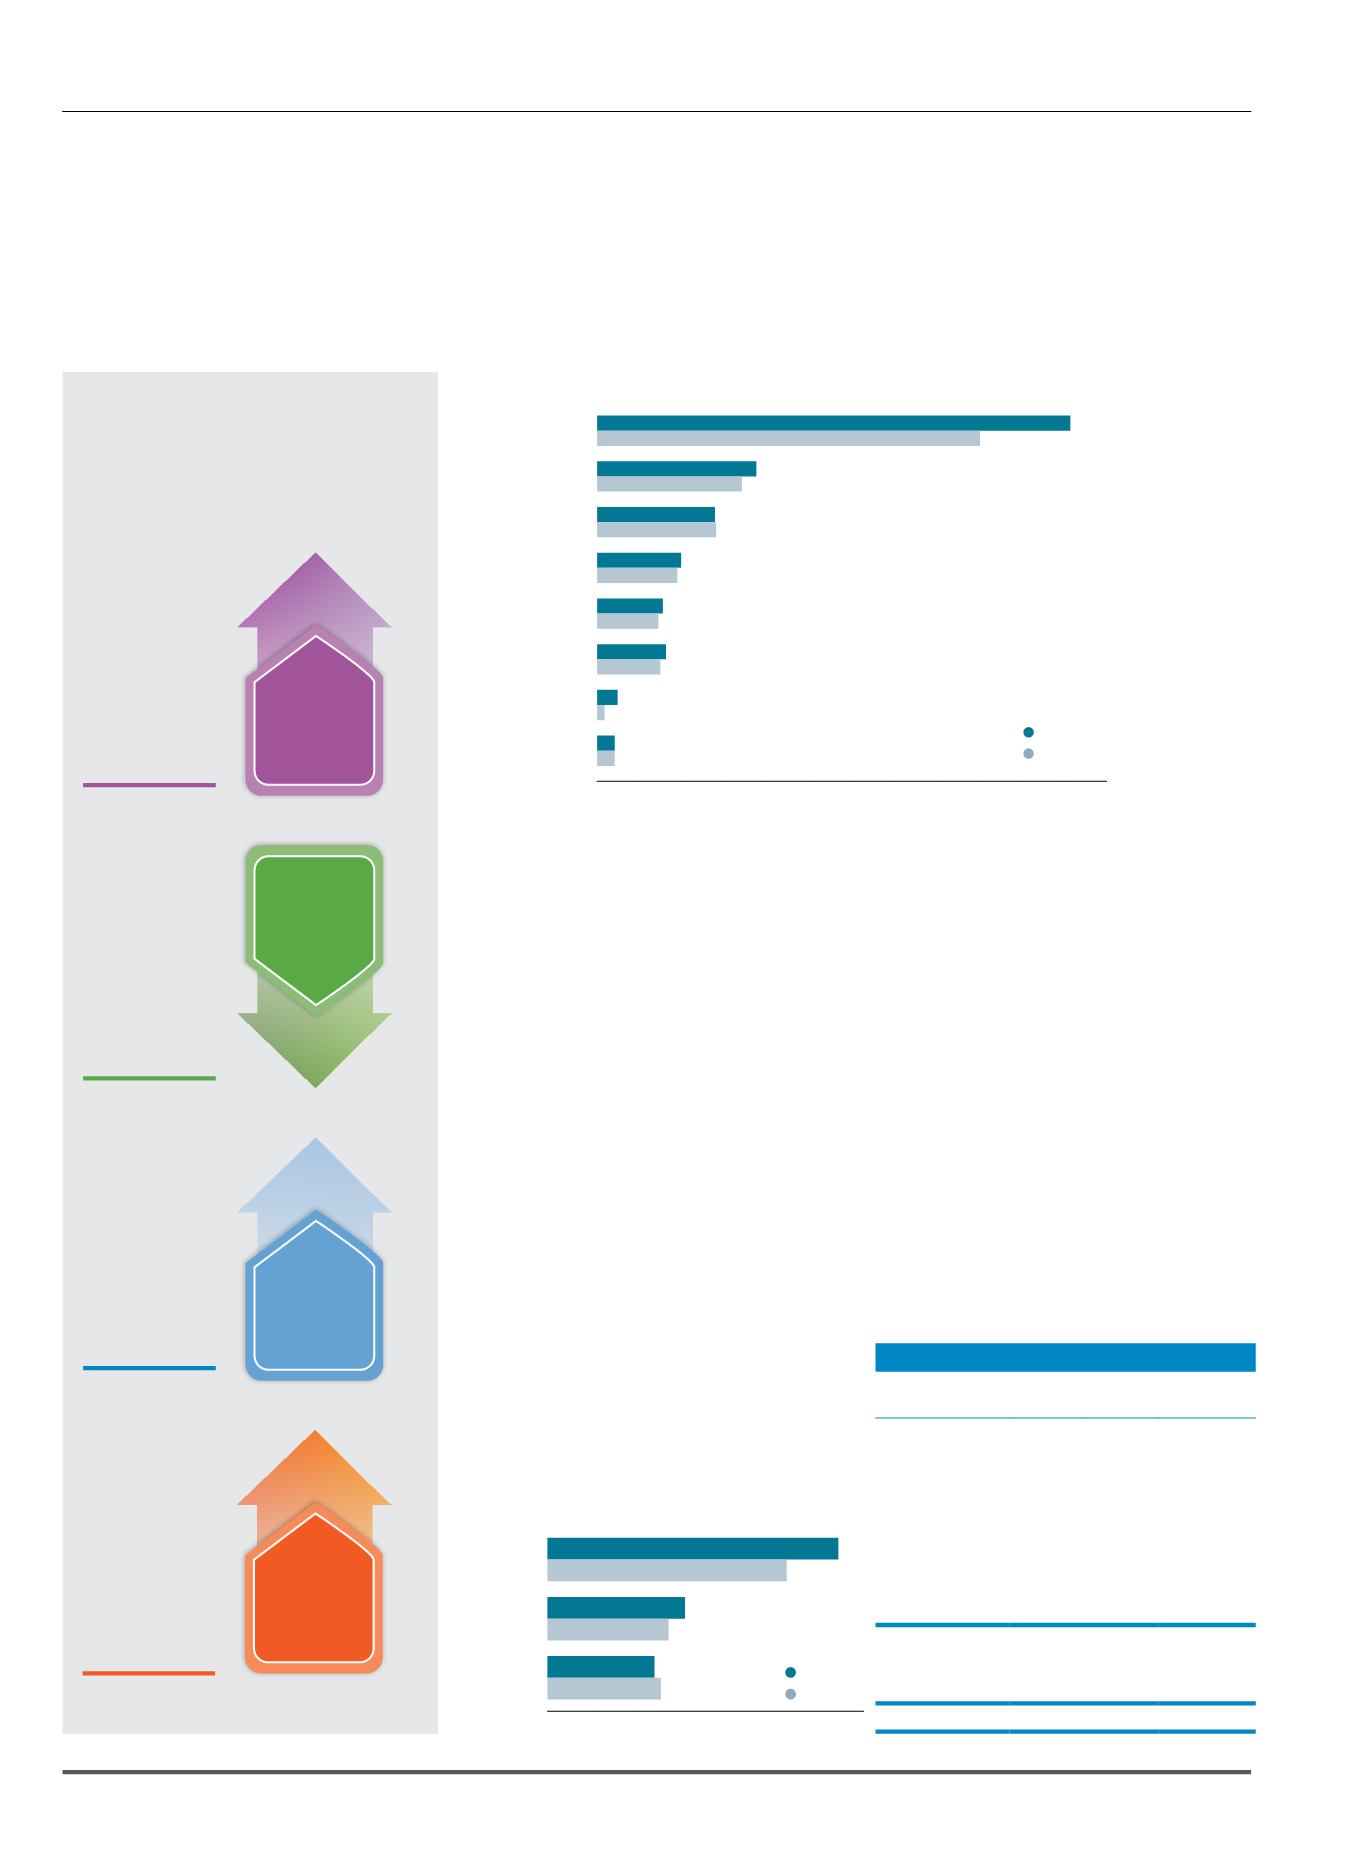
Operating Revenue (RM million)
0 20 40 60 80 100 120 140 160 180 200 220
10% Growth in Operating Expenses;
Investments for the Future
The year saw our operating expenses rising to RM229.4
million from RM209.2 million in 2012. The year’s
expenditure focused on strengthening our talent pool
in order to elevate the Exchange to a HPO. To this end,
we invested in competitive remuneration packages to
retain top talent and brought in new talent to close skill
gaps. As a result, our manpower costs rose by 18% to
RM120.0 million.
Our technology costs comprise system depreciation
and maintenance, as well as Globex service fees. The
enhancements to our core systems in 2013 increased
depreciation and maintenance costs by 8% to RM45.4
million, while the higher volume of derivatives contracts
traded on Globex increased service fees by 16% to
RM15.8 million.
Technology Refresh Successfully
Completed
In 2011, we commenced the refresh of our core trading,
clearing and regulatory systems. The replacement
of our old securities trading engine with Bursa Trade
Securities 2 in December 2013 marked a significant
milestone towards the completion of the technology
refresh programme.
Returning Value to Shareholders with a
52 sen Dividend
To celebrate 2013’s commendable financial
performance and with our technology refresh
drawing to a close, we have proposed to return
98.5% of 2013’s PATAMI to our shareholders. On top
of this, we have also paid out a special dividend of
20 sen per share in August 2013. If the final dividend
of 16 sen per share is approved at the Company’s
AGM in March 2014, our shareholders will be
rewarded with a total dividend of 52 sen per share,
representing a 6.3% dividend yield.
Segmental Performance
In the year under review, our key Securities and
Derivatives Market segments made good progress,
while our Islamic and Alternative Markets started to
make positive contributions to our profit.
Segmental Profit
2013 2012
RM
million
RM
million % Change
Segmental Profit
From:
Securities Market
256.8
223.2
+15%
Derivatives Market
44.6 42.2
+6%
Islamic and
Alternative
Markets
0.9
(0.6)
+253%
Exchange Holding
3.7
5.8
-36%
Total Segmental
Profit
306.0
270.7
+13%
Overheads
(60.4)
(55.3)
+9%
Profit Before Tax
245.6 215.3
+14%
Securities
Trading Revenue
Derivatives
Trading Revenue
Listing and
Issuer Services
Depository
Services
Market Data
Member Services
and Connectivity
BSAS Trading
Revenue
Other Operating
Revenue
217.3
178.5
70.3
63.3
51.3
51.4
37.4
36.4
26.0
24.1
26.4
25.8
5.8
3.4
5.6
5.6
2013
2012
0 20 40 60 80 100 120
Manpower
Technology
Costs
Other
Costs
120.0
101.8
61.2
55.7
48.2
51.7
improved
1percentage
point
improved
3percentage
points
Operating Expenses (RM million)
Chief Executive Officer’s Message and Management Discussion and Analysis
From the Board of Directors and Senior Management


