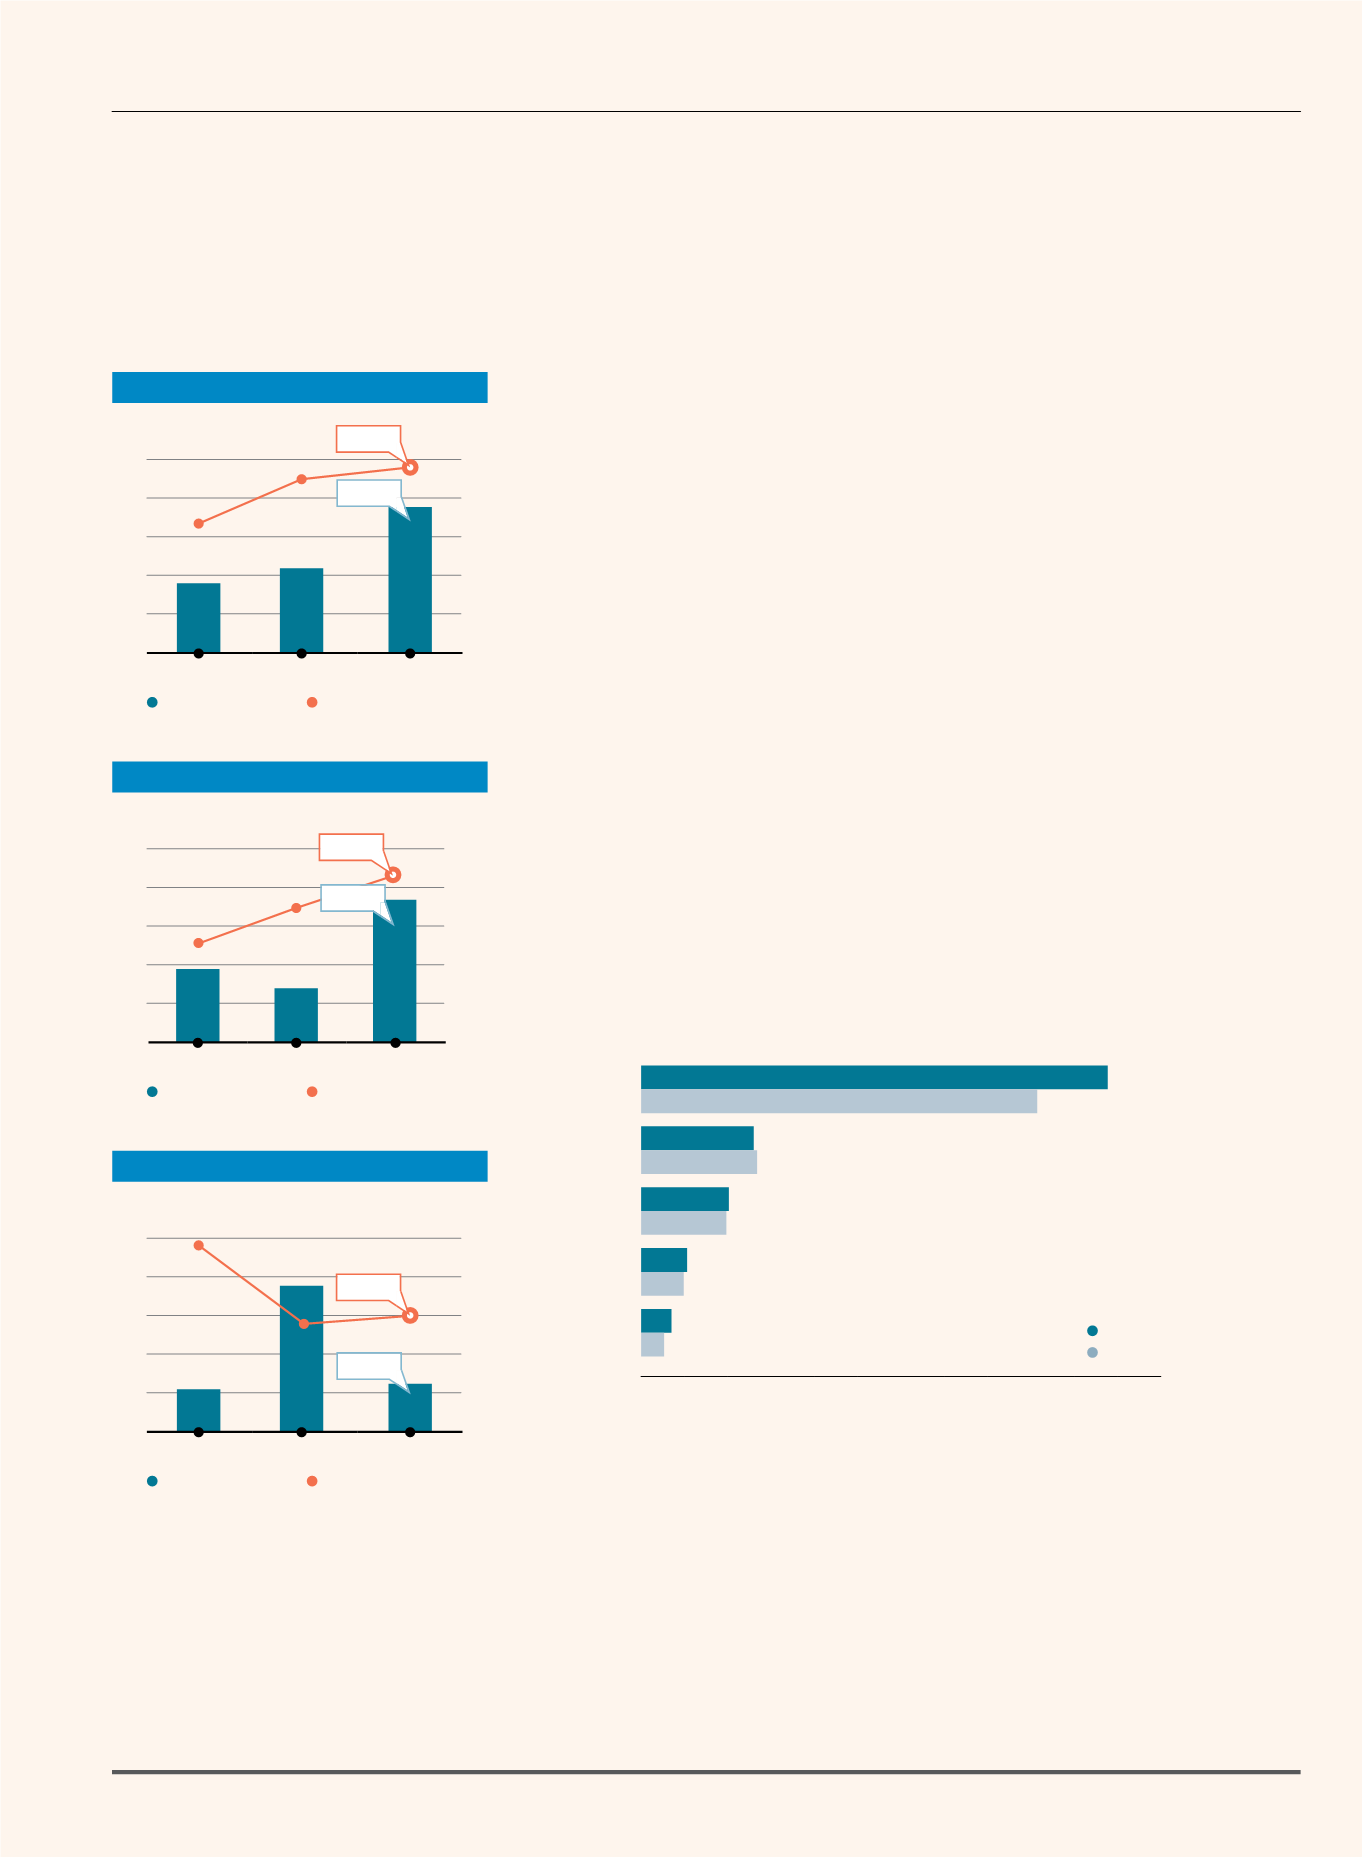
Segment Profit and Operating Margin
ADV and FBM KLCI
No. of New Listings and Funds Raised
2000
1800
1600
1400
1200
1000
30
24
18
12
6
0
2.4
2.2
2.0
1.8
1.6
1.4
30
24
18
12
6
0
ADV
Funds Raised
FBM KLCI
No. of New Listings
(RM billion)
(Point)
(RM billion)
2011
2012
2013
2011
2012
2013
2.1
1867
18
MARKET HIGHLIGHTS
Trading Activity on the Uptrend
The Securities Market performed admirably in 2013. Trading revenue rose 22% to RM217.3 million from
RM178.5 million. Segmental profit rose 15% to RM256.8 million from RM223.2 million in 2012, while
operating margin improved to 73.6% from 72.9% in 2012.
Total trading value rose 29% to RM527.83 billion from RM408.26 billion previously, while ADV touched
RM2.1 billion, a 28% increase over ADV of RM1.7 billion in 2012. The FBM KLCI hit an all-time high of
1,872.52 points on 30 December 2013 and closed the year at 1,866.96 points, 10.5% higher than the
preceding year end’s 1,688.95 points.
New Listings Bring a New Investment Flavour
The year saw 18 new listings on Bursa Malaysia in comparison to 17 listings in 2012. These IPOs collectively
raised funds amounting to RM8.2 billion and had a combined market capitalisation of RM36.8 billion upon
listing - well within our expectations. The largest of these were the IPOs of UMW Oil & Gas Corporation
Berhad, Westports Holdings Berhad and AirAsia X Berhad, which together raised RM5.4 billion in funds.
The year’s listings also brought a new investment flavour to the diversity of products that the Exchange offers
to meet the different needs of investors. May 2013 saw the listing of the first Malaysian stapled securities with
RM13.1 billion market capitalisation, comprising shares of KLCC Property Holdings Berhad and units of KLCC
REIT. On top of this, two Special Purpose Acquisition Companies (SPACs), namely Cliq Energy Berhad and Sona
Petroleum Berhad were listed in April and July 2013 respectively, collectively raising close to RM1 billion.
2013
2012
8.2
Bursa Malaysia • Annual Report 2013
31
SECURITIES MARKET
74
72
70
68
66
64
280
260
240
220
200
180
Segment Profit
Operating Margin
(RM million)
(%)
2011
2012
2013
256.8
73.6
217.3
178.5
51.1
51.3
37.1
36.4
19.3
18.4
14.0
11.3
Operating Revenue (RM million)
0 20 40 60 80 100 120 140 160 180 200 220
Trading
Revenue
Listing and
Issuer Services
Depository
Services
Market
Data
Member Services
and Connectivity
Chief Executive Officer’s Message and Management Discussion and Analysis
From the Board of Directors and Senior Management


