DERIVATIVES MARKET
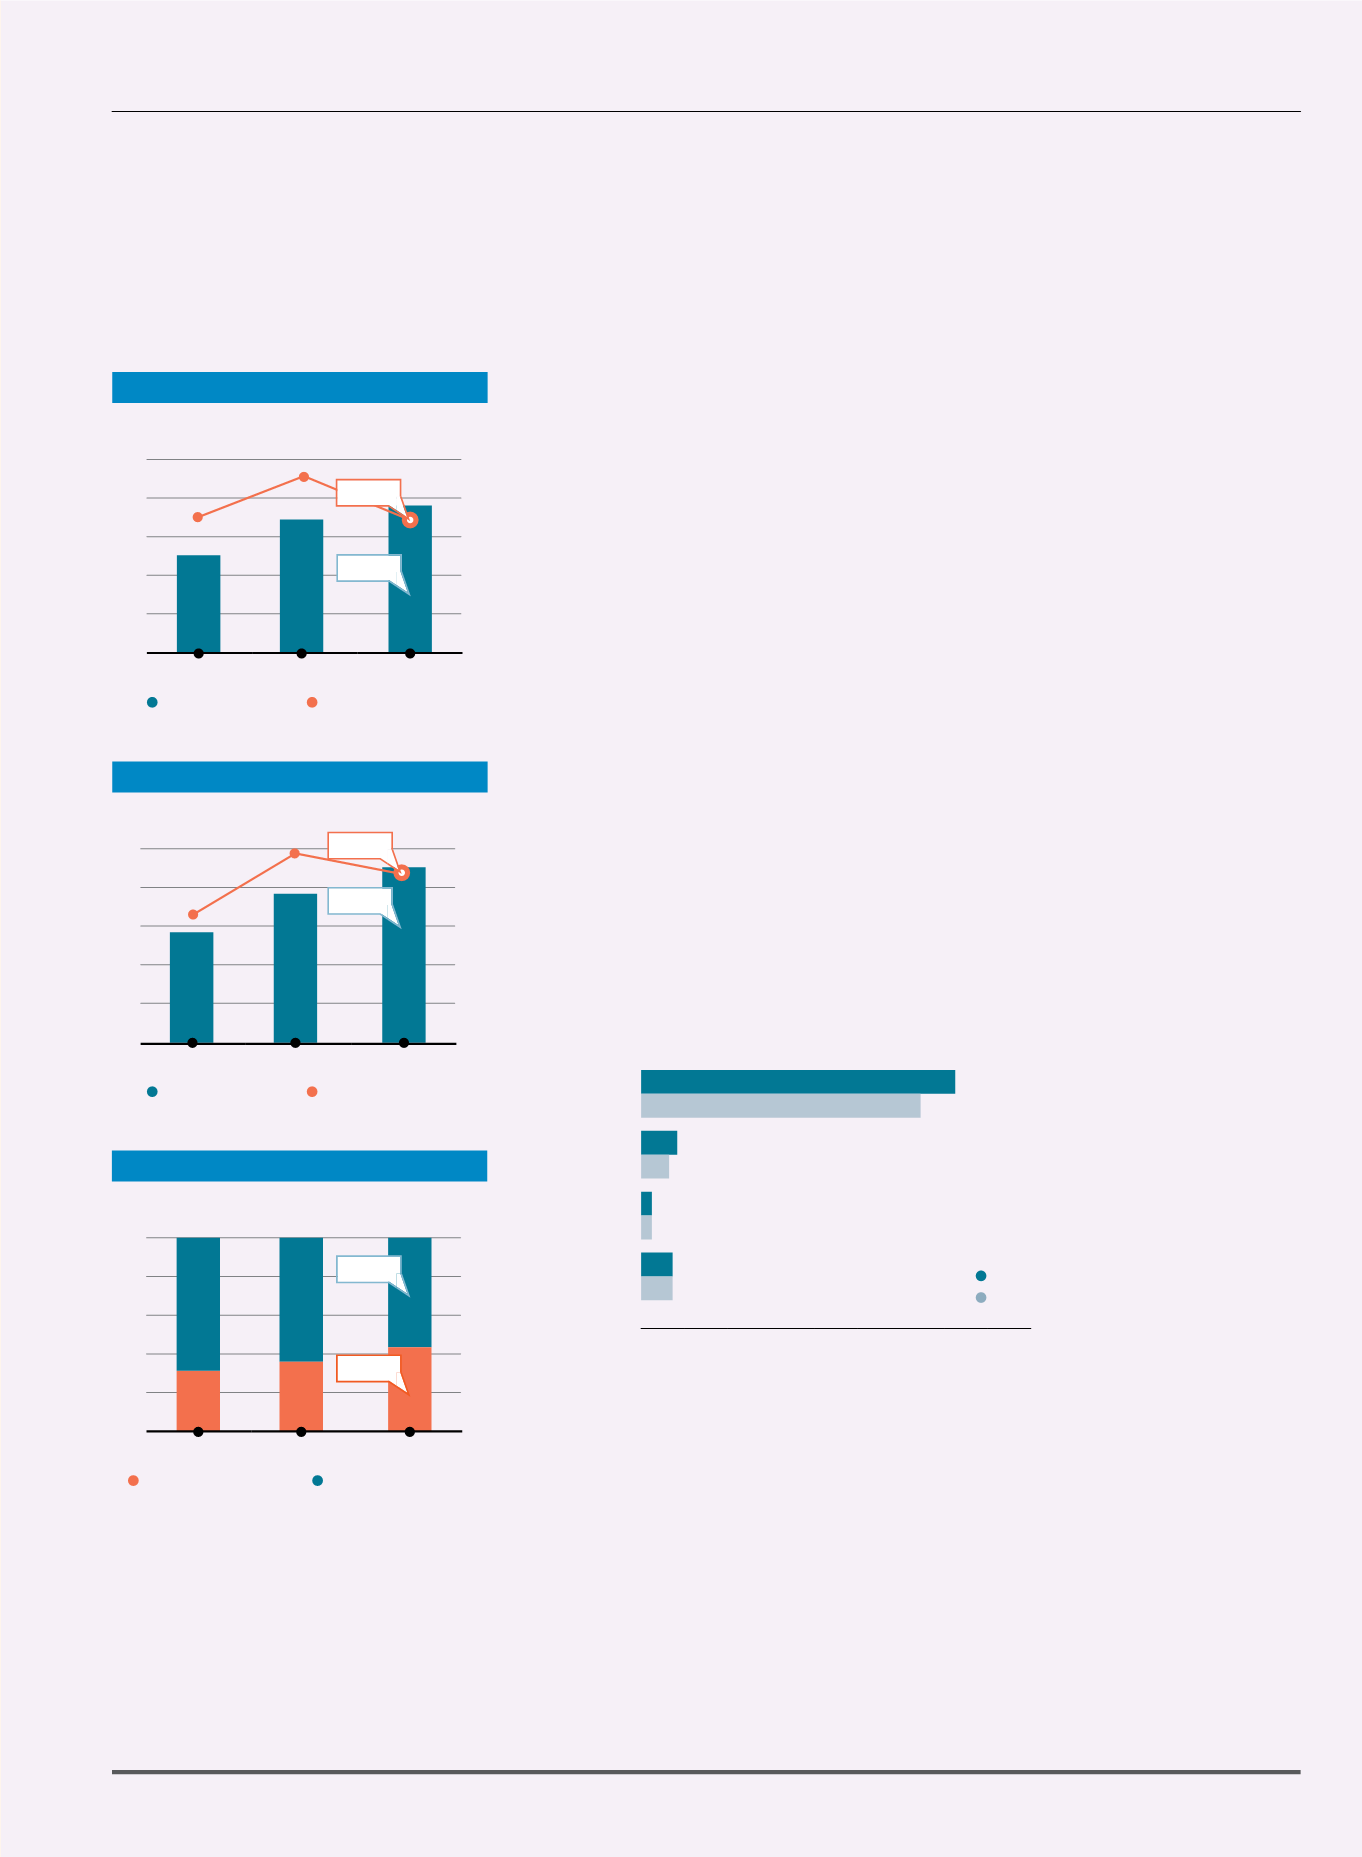
Segment Profit and Operating Margin
ADC and Open Interests
220
180
140
100
60
20
45
40
35
30
25
20
ADC
Open Interests
(’000)
(’000)
43
196
54
52
50
48
46
44
50
45
40
35
30
25
Segment Profit
Operating Margin
(RM million)
(%)
2011
2012
2013
2011
2012
2013
44.6
50.8
MARKET HIGHLIGHTS
A Year Characterised by High Volume Growth
2013 was an eventful year for the Derivatives Market which experienced high volume growth.Trading revenue
rose by 11% to RM70.3 million from RM63.3 million previously, while segmental profit rose 6% to RM44.6
million from RM42.2 million in 2012, a testament that outreach among foreign institutions in particular is
bearing fruit. However, the segment’s operating margin dropped to 50.8% from 53.3% previously due to an
increase in fixed costs namely manpower and technology costs.
Encouraging Performance on Several Fronts
Average Daily Contracts (ADC) traded increased to 43,490 contracts in 2013 from 39,387 contracts in
2012. The total volumes traded on the Exchange broke the 10 million mark where it increased by 11% to
10,742,098 contracts from 9,649,707 contracts in 2012.
Our derivatives market recorded four new all-time record highs in 2013:
• Open Interest (OI) for all products hit a new high of 258,001 contracts on 26 July 2013;
• The OI for FCPO touched an all-time high of 202,901 on 29 July 2013;
• FCPO traded volume hit an all-time month high of 856,252 contracts in the month of July 2013;
• The Derivatives Market surpassed the 10 million contract mark in December 2013.
Business developmental efforts led to volume growth and increased participation from international players.
The visibility and accessibility of the Derivatives Market via the Globex trading platform has enhanced foreign
participation for all derivatives products, with foreign participation increasing to 42% in 2013 from 36% in 2012.
Foreign vs. Domestic Participation
100
80
60
40
20
0
Foreign Participation
Domestic Participation
(%)
2011
2012
2013
58
42
Bursa Malaysia • Annual Report 2013
33
Operating Revenue (RM million)
2013
2012
Trading
Revenue
Market
Data
Member Services
and Connectivity
Conference
Income
0 10 20 30 40 50 60 70 80
70.3
63.3
6.5
5.6
2.1
2.1
5.6
5.6
Chief Executive Officer’s Message and Management Discussion and Analysis
From the Board of Directors and Senior Management


