


 44 / 206

FROM THE BOARD OF DIRECTORS AND SENIOR MANAGEMENT
Bursa Malaysia
•
Annual Report 2014
32
CEO’S MESSAGE AND MANAGEMENT DISCUSSION AND ANALYSIS
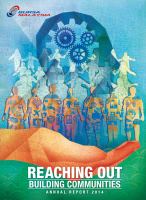
2013 2014
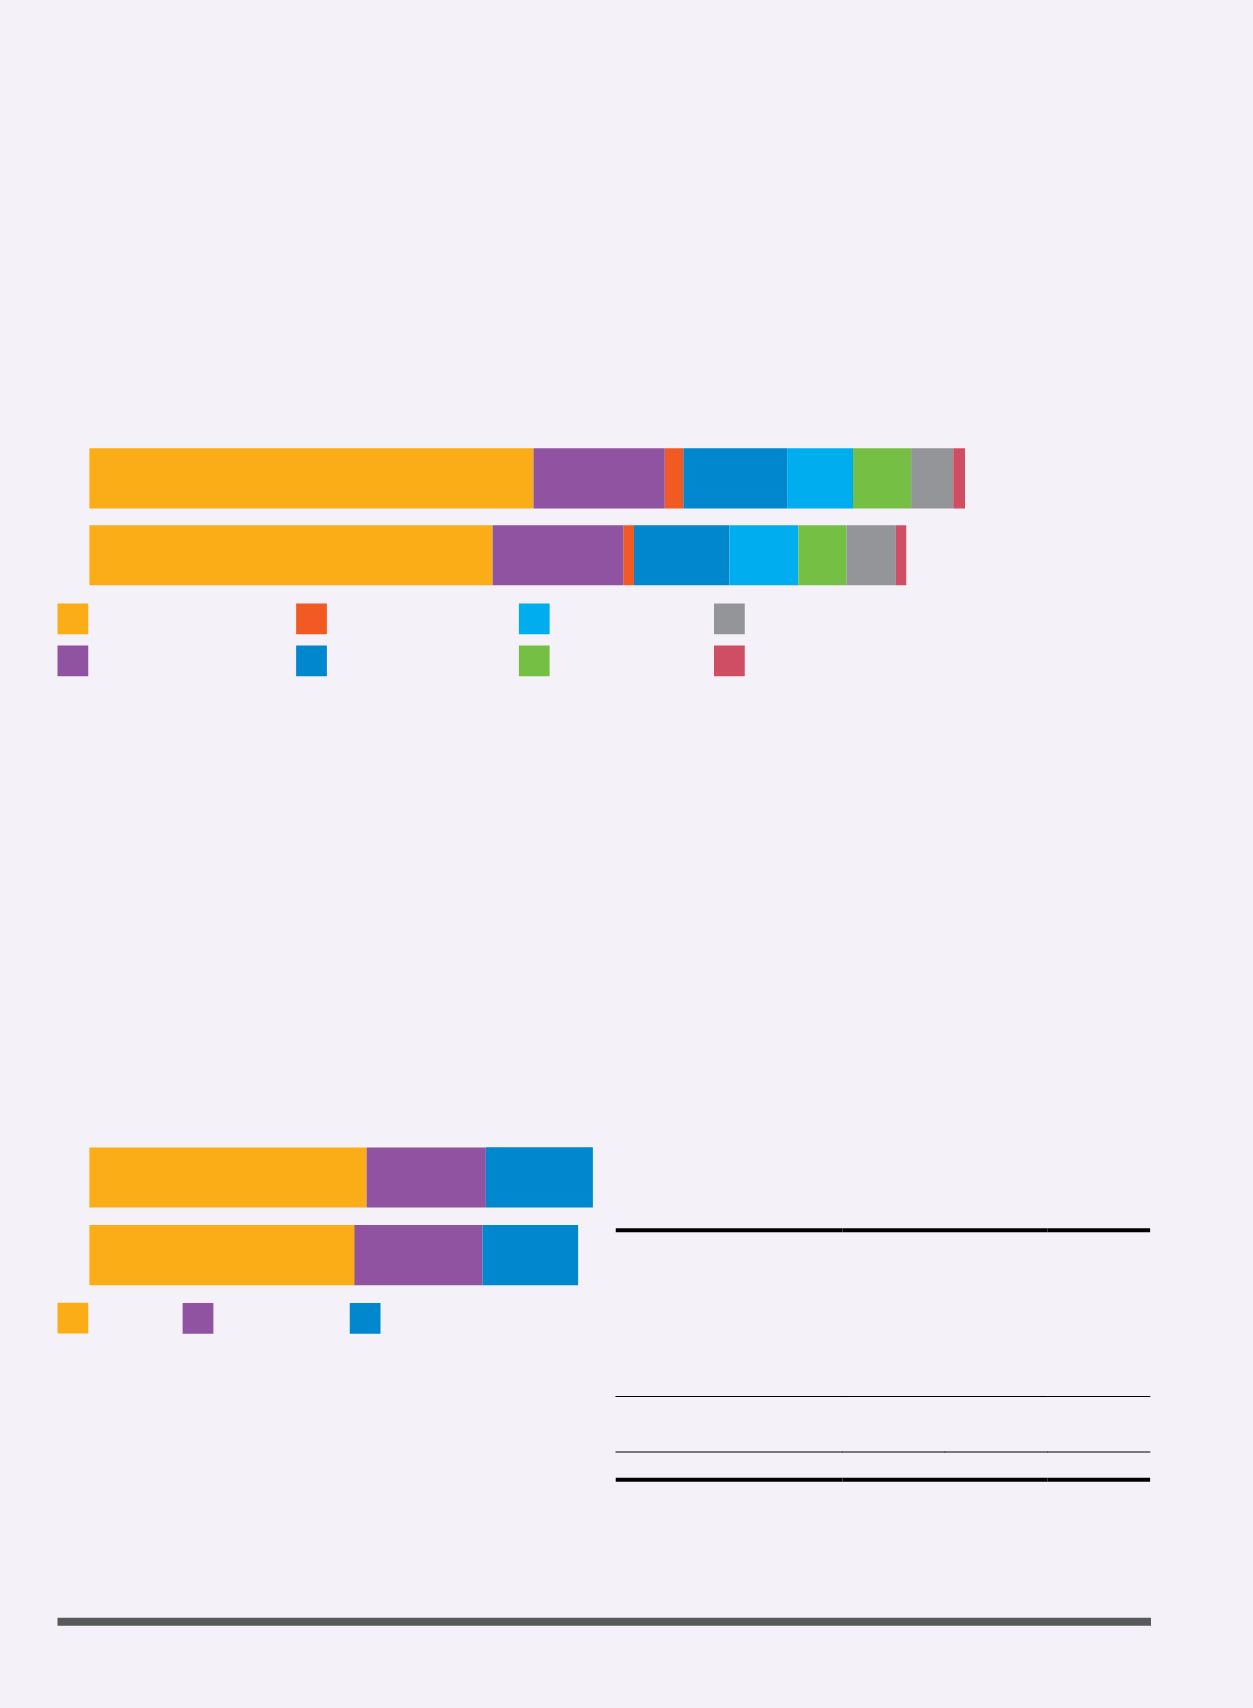
2013 2014
127.6
120.0
55.1
61.2
49.3
48.2
217.3
70.3 5.8 51.3
37.1 26.0 26.4
5.6
239.1
70.6 10.0 55.9
35.4 31.3 22.7
6.3
Securities Trading Revenue
Derivatives Trading Revenue
Manpower
Depository Services
Market Data
BSAS Trading Revenue
Listing & Issuer Services
Technology Costs
Member Services & Connectivity
Other Operating Revenue
Meanwhile, Bursa Suq Al-Sila’ (BSAS) trading continued its upward trend with revenue growing by 72% to RM10.0 million in 2014. The continuous revenue
growth in BSAS trading over the last few years is a positive indication of the growing acceptance of BSAS by domestic banks and sukuk issuers, which bodes
well for us as our strategy calls for us to leverage on Malaysia's status as a leading Islamic capital market.
OPERATING EXPENSE STABILISED;
TECHNOLOGY INVESTMENT YIELDING SAVINGS
Total operating expenses grew by 1% to RM232.0 million in 2014 compared
to RM229.4 million in 2013. Our expenses for the year continued to focus on
talent building and development to support our vision of transforming into a
HPO. Staff costs rose 6% to RM127.6 million in 2014 from RM120.0 million
in 2013.
Other operating expenses, which include marketing and development,
professional fees and administrative expenses, continued to grow as we
expanded our capabilities and our reach into the region. However, the overall
growth in our operating expenses was offset by lower depreciation costs as we
had successfully replaced our previous trading system with a higher capacity
but more cost efficient Bursa Trade Securities 2 (BTS 2).
Other Costs
REWARDING OUR SHAREHOLDERS
Bursa Malaysia’s Board of Directors has recommended a final dividend of
18 sen subject to shareholders’ approval at our Annual General Meeting to be
held in March 2015. If approved, the total dividend paid by Bursa Malaysia in
2014 will amount to 54 sen per share, which includes a 20 sen special dividend
and a 16 sen interim dividend paid in August 2014. The total dividend paid of
RM288.1 million represents a 6.7% dividend yield.
SEGMENTAL PERFORMANCE
The Securities Market, as well as the Islamic and Alternative Markets (IAM),
continued to make good progress, while the Derivatives Market was affected
by lower guarantee and collateral management fees earned. Exchange
Holding was affected by lower broker services from the rationalisation effort
undertaken by Bursa Malaysia to enable brokers to use their own network,
and lower interest income earned subsequent to the distribution of a special
dividend in 2013 and 2014 respectively.
2014
2013
Segmental Review
RM million RM million % change
Segmental Profit/(Loss) From:
Securities Market
294.3
256.8
+15%
Derivatives Market
40.8
44.1
-7%
Islamic & Alternative Markets
5.4
0.9
+500%
Exchange Holding
(8.9)
3.1
-387%
Total Segmental Profit
331.6
304.9
+9%
Overheads
(59.8)
(59.3)
+1%
Profit Before Tax
271.8
245.6
+11%
OPERATING REVENUE (RM million)
OPERATING EXPENSES (RM million)