
CEO’S MESSAGE AND MANAGEMENT DISCUSSION AND ANALYSIS
SECURITIES MARKET
MARKET AND FINANCIAL HIGHLIGHTS
The FBM KLCI hit an all-time high of 1,892.65 points on 8 July 2014 but moderated to close the year at
1,761.25 points, 5.7% lower than the preceding year end’s 1,866.96 points.
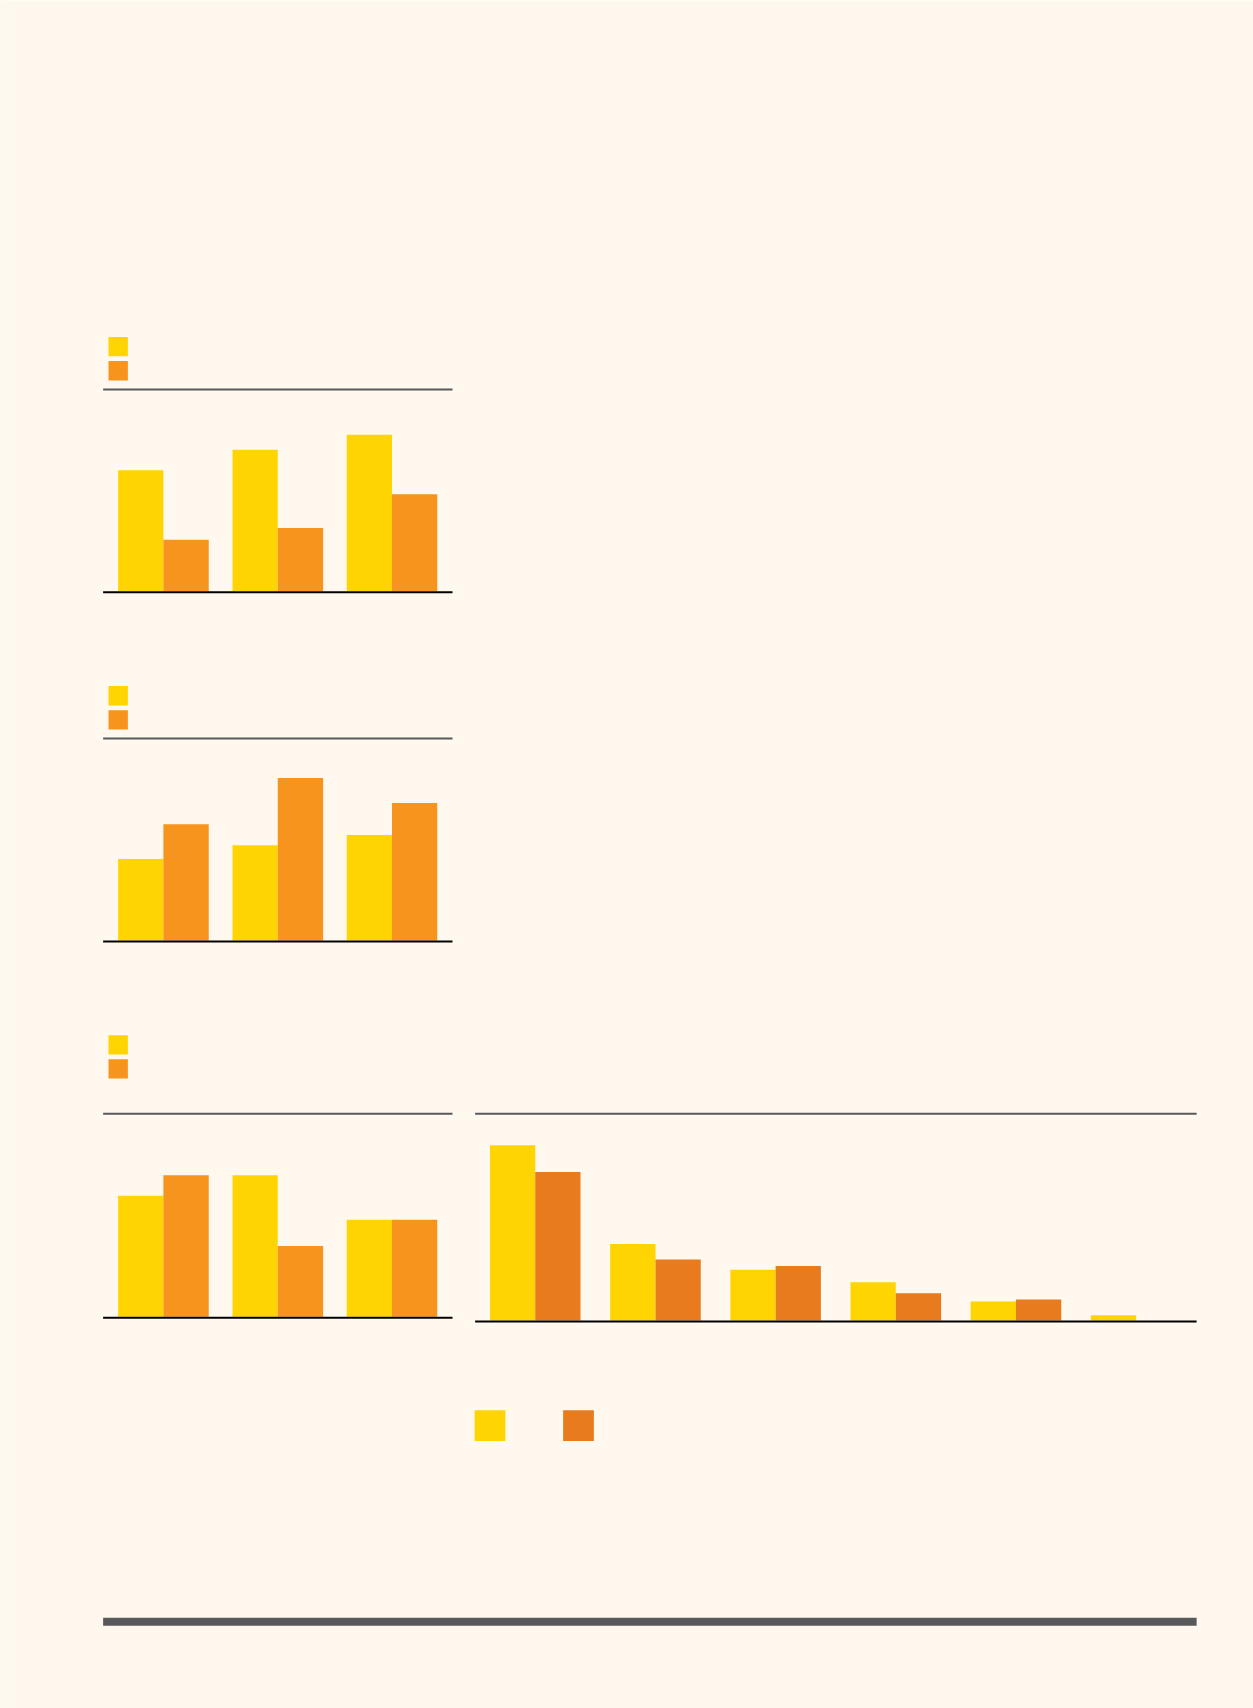
SECURITIES TRADING MAINTAINS MOMENTUM
The Securities Market continued its upward trend, reporting a profit contribution increase of 15% to RM294.3
million from RM256.8 million in 2013. Total operating revenue rose 9% to RM368.1 million from RM338.8
million in 2013.
Trading revenue continued to grow, increasing 10% to RM239.1 million from RM217.3 million in 2013 as
a result of higher ADV for on-market trades (OMT) of RM2.1 billion from RM1.9 billion in 2013. Domestic
participation ADV for OMT grew 11% to RM1.6 billion in 2014 from RM1.4 billion in 2013, while foreign
participation ADV for OMT declined 3% to RM0.5 billion in 2014.
Other factors contributing to the upward trend of the Securities Market include the higher number of corporate
exercises as well as a higher number of structured warrants listings. The Market Data segment also posted
higher revenues of RM24.0 million, up 24% from RM19.3 million in 2013, contributing to the overall growth
in Securities Market revenue. Growth in the Market Data segment is attributed to the introduction of new
information packages such as non-display usage data and corporate announcements.
RETAIL INVESTORS KEY DRIVERS OF GROWTH
Improvements in the Securities Market trading revenue contributions were mainly driven by higher ADV for
OMT of RM2.05 billion, up 7% from RM1.92 billion in 2013, as well as higher effective clearing fee rate.
We saw an increase in market activity by retail investors due primarily to global uncertainties, which spurred
active trading. The greater retail investors participation was achieved through our constant outreach activities
over the last few years. In 2014, retail participation in the Securities Market rose 4 percentage points to
represent 26% of total activity (from 22% in 2013).
OPERATING REVENUE
(RM million)
Trading Revenue Listing and
Issuer Services
Depository
Services
Market Data
Member
Services and
Connectivity
Conference
Income
239.1
55.8
35.4
24.0
13.6
0.2
217.3
51.1
37.1
19.3
14.0
-
2014
2013
SEGMENT PROFIT AND OPERATING MARGIN
Segment Profit (RM million)
Operating Margin (%)
ADV AND FBM KLCI
ADV (RM billion)
FBM KLCI
NO. OF NEW LISTINGS AND FUNDS RAISED
No. of New Listings
Funds Raised for IPOs & Secondary
Market (RM billion)
2012
2013
2014
2012
2013
2014
2012
2013
2014
294.3
2.2
14
256.8
2.1
18
223.3
1.7
17
77.3
24.3
73.6
22.5
72.9
1,688.95
1,866.96
1,761.25
31.7
FROM THE BOARD OF DIRECTORS AND SENIOR MANAGEMENT
Bursa Malaysia
•
Annual Report 2014
33


